Download
1 / 20
200 likes | 314 Views
OA Cancelled due to technical difficulties… . Tonight’s HW is A2: 541(11b = PANIC and 11d) We will start using the books next Friday!.

E N D
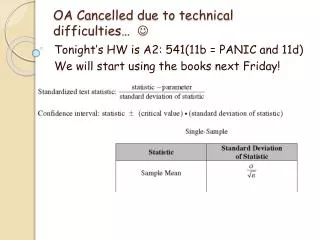
OA Cancelled due to technical difficulties… Tonight’s HW is A2: 541(11b = PANIC and 11d) We will start using the books next Friday!
Chapter 23: Confidence Intervals for a Population MeanIn addition to using interval estimates for population proportions (p), we can also use confidence intervals to estimate the true value of a population mean (µ).
The formula for a CI for a population mean is based on the sampling distribution of the sample mean . Recall that: • is approximately normally distributed when n > 30 or when the population is normal.
Thus far, we have been using z-critical values from the normal distribution to make our confidence intervals.
Now, remember that a z-score is calculated as • As long as is normally distributed, the distribution of z will also be normal. Why? • Since m, s, n are all constants, the shape shouldn’t change, only the center and spread.
However, if we don’t know s(the population standard deviation) and we use s (the sample standard deviation) to estimate s, the distribution of isn’t quite normal, even if is approximately normal. So, we give this quantity a new name:
If you have your book open it to the back and look at it now. You will get t-tables on the AP exam and can also find them in the back of your book.
Since t is based on 2 variables (s and ) instead of just (like z), • the t-distributions have more variability than the z (normal) distribution. • However, as the sample size increases, s gets closer to sand the t-distributions get closer to the standard normal distribution (z). • The t-curves are very similar to normal curves, except that they are wider and defined by a number called the DEGREES OF FREEDOM. For this chapter, df = n – 1.
Properties of the t-distributions: • The t-curve corresponding to any fixed number of degrees of freedom (df) is bell-shaped, symetricand centered at 0. • Each t-curve is more spread out than the z-curve (standard normal curve). • As the df increase, the spread of the corresponding t-curve decreases. • As the number of df increases, the t-curves get closerto the z-curve.
T-curves are wider than the z-curve, so we must go further than 1.96 SD to capture 95% of the area. • To find out how far, we use a t-critical value from the t-table. • If df = 20 and you want 95% confidence, what t-critical value should you use? • Thus, to capture the middle 95% of the t-distribution with 20 df, you must go out 2.086stdev. 2.086
2.262 1.711 2.369 Find the t critical values for the following: • a. 95% confidence with n = 10 • b. 90% confidence with n = 25 • c. 99% confidence with n = 100 • When using the t-table and the df you want are not provided, round down to the nearest df given.
Suppose that a machine is designed to produce bolts that have a diameter of 5 mm. Every hour a random sample of 15 bolts is selected and a 95% confidence interval for the mean diameter is constructed. If there is evidence that m ≠ 5, the machine is adjusted. In one particular sample, the mean diameter was 5.08 mm with a standard deviation of 0.11 mm. Calculate the interval and decide if you need to adjust the machine. • It is asking for a confidence interval, what should we do?
P: We want to estimate the true mean bolt diameters that the machine is producing (mD). A: • We have a random sample of 15 bolts. • With a SRS, each bolt diameter is independent of the other. • Assuming there are at least 150 bolts produced each hour, our sample is less than 10% of the population. • LEN - …
3 ways to satisfy LEN: • Data comes from a normal population • Graphed data is unimodal and symmetric • n > 30 None of these are true but… LEN: It is reasonable to assume that bolt diameters produced by the machine are normally distributed.
N: The conditions for a 95% 1-sample t interval have been met. DF = 14.
I: =5.08 2.145(.11/√15) = (5.091, 5.1409) C: I am 95% confident that the interval from 5.091to 5.1409captures the true mean diameter of bolts. Does the machine need to be adjusted?