Download
1 / 13
130 likes | 295 Views
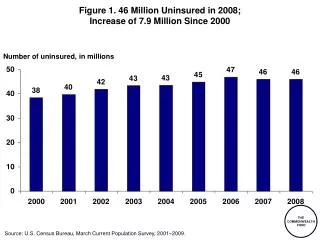
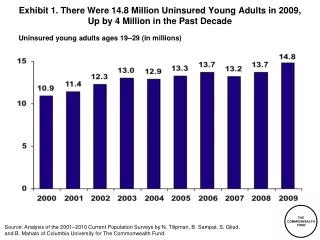
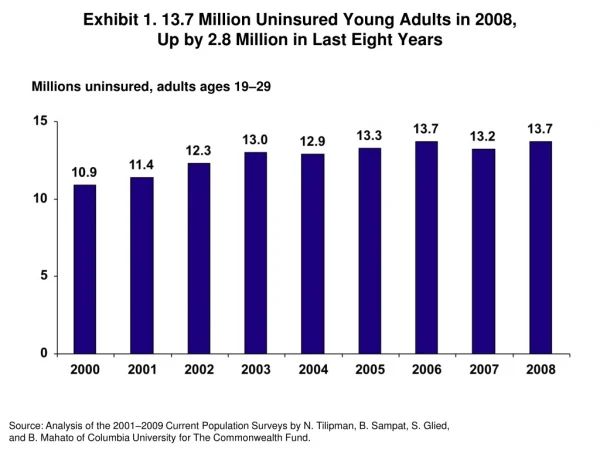
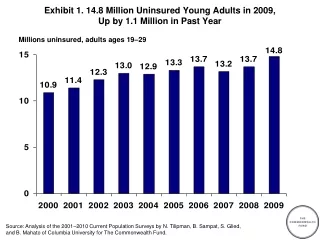
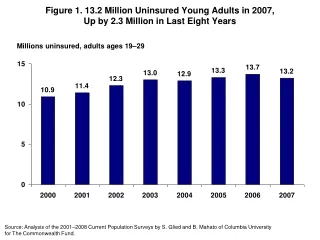
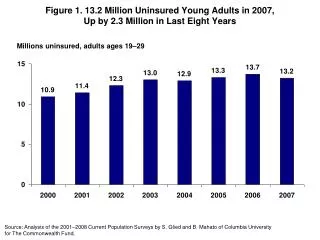
Figure 1. 13.2 Million Uninsured Young Adults in 2007, Up by 2.3 Million in Last Eight Years. Millions uninsured, adults ages 19–29. Source: Analysis of the 2001–2008 Current Population Surveys by S. Glied and B. Mahato of Columbia University for The Commonwealth Fund.

E N D
Figure 1. 13.2 Million Uninsured Young Adults in 2007,Up by 2.3 Million in Last Eight Years Millions uninsured, adults ages 19–29 Source: Analysis of the 2001–2008 Current Population Surveys by S. Glied and B. Mahato of Columbia University for The Commonwealth Fund.
Figure 2. Nearly 30 Percent of Young Adults Ages 19–29 Are Uninsured; They Are Also Disproportionately Represented Among the Uninsured Percent uninsured Age 18and under 20% Ages 50–64 16% Ages 19–23 13% Ages 36–49 24% Ages 24–29 16% Ages 30–35 11% Age groups Nonelderly uninsured = 45.0 million Source: Analysis of the March 2008 Current Population Surveyby S. Glied and B. Mahato of Columbia University for The Commonwealth Fund.
Figure 3. Nearly 70 Percent of Uninsured Young Adults Are in Households with Annual Incomes Below 200 Percent of the Federal Poverty Level Other 7% 200% FPL or more 32% Less than 100% FPL 39% White 46% Hispanic 32% 100%– 199% FPL 29% African American 15% Uninsured young adults = 13.2 million Note: Numbers may not sum to 100% because of rounding. FPL = federal poverty level. Source: Analysis of the March 2008 Current Population Survey by S. Glied and B. Mahato of Columbia University for The Commonwealth Fund.
Figure 4. Uninsured Rates Among Part-Time Students and Non-Students Ages 19–23 Are About Twice That of Full-Time Students Own-employer 7% Uninsured 18% Own- employer 26% Uninsured 37% Individualor collegeplans 19% Employer- dependent 48% Employer- dependent 15% Other* 14% Other* 8% Individual orcollege plans 7% Not full-time students** = 12.4 million Full-time students = 7.8 million * Other includes Medicare, Medicaid, and Military. ** Includes part-time students and non-students. Source: Analysis of the March 2008 Current Population Survey by S. Glied and B. Mahato of Columbia University for The Commonwealth Fund.
Figure 5. Nineteenth Birthdays Are Critical Turning Points in Coveragefor Young Adults Source: Analysis of the March 2008 Current Population Survey by S. Glied and B. Mahato of Columbia University for The Commonwealth Fund.
Figure 6. Nearly Two-Thirds of Young Adults Ages 19–23Spent Some Time Uninsured over a Three-Year Period, 2001–2003* Percent of young adults * Young adults who were ages 19 to 23 in 2001 were followed over 2001–2003. Data show what percent had time uninsured during that period. Source: Analysis of the 2001 Panel of the Survey of Income and Program Participation by E. Gould of the Economic Policy Institute for The Commonwealth Fund.
Figure 7. Nearly Two-Fifths of High School GraduatesWho Did Not Go to College Experienced Gaps in Insurance Coveragein the Year Following High School Graduation, 2001–2003* Percent of high school graduates * People who graduated from high school during 2001–2003. Source: Analysis of the 2001 Panel of the Survey of Income and Program Participation by E. Gould of the Economic Policy Institute for The Commonwealth Fund.
Figure 8. One-Third of College Graduates Had a Time Uninsured in the Year Following College Graduation, 2001–2003* Percent of college graduates * People who graduated from college during 2001–2003. Note: College graduates are defined as those with at least a bachelor’s degree. Source: Analysis of the 2001 Panel of the Survey of Income and Program Participation by E. Gould of the Economic Policy Institute for The Commonwealth Fund.
Figure 9. More Than Half of Young Adults Are Overweight or Obese,Two of Five Report Binge Drinking or Smoke Cigarettes,and 15 Percent Have a Chronic Health Condition Percent of young adults with the following health problems: 7 1 2 3 5 6 4 1 Data from 2005–2006; ages 18–29. 2 Binge drinking defined as ‘drinking five or more drinks on the same occasion on at least one day in the past 30 days’; data from 2006; ages 18–25. 3 Data from 2006; ages 18–25. 4 Data from 2003–2004; women ages 20–29. 5 Any chronic condition includes physician-diagnosed arthritis, asthma, cancer, diabetes, heart disease, or hypertension; data from 2004–2006; ages 18–29. 6 Mental disorders include major depression, generalized anxiety disorder, and panic disorder; data from 1999–2004; ages 20–29. 7 Data from 2004–2006; ages 18–29. Source: National Center for Health Statistics, “Health, United States, 2008” (Hyattsville, Md.: NCHS, 2009).
Figure 10. Two-Thirds of Uninsured Young AdultsHad Cost-Related Access Problems in the Past Year,Compared with One-Third of Those Who Were Insured All Year Percent of adults ages 19–29 reporting the following problems in the past year because of cost: Source: The Commonwealth Fund Biennial Health Insurance Survey (2007).
Figure 11. Young Adults Without Insurance Are Less Likelyto Have a Regular Doctor Than Those Who Are Insured All Year Percent of adults ages 19–29 who have a regular doctor Source: The Commonwealth Fund Biennial Health Insurance Survey (2007).
Figure 12. Half of Young Adults with Any Time Uninsured Had Medical Bill or Debt Problems, Twice That of Young Adults Who Were Insured All Year Percent of adults ages 19–29 who had the following problems in past year: * Includes only those whose bill was sent to a collection agency when they were unable to pay the bill. Source: The Commonwealth Fund Biennial Health Insurance Survey (2007).
Figure 13. Young Adults Ages 19–29 Have Lower Annual Expenditureson Health Care Than Middle-Age and Older Adults Dollars * Inflated to 2009 dollars using actual and estimated annual growth rates in national health expenditures. Source: Analysis of the 2006 Medical Expenditure Panel Survey by S. Glied and B. Mahato of Columbia University for The Commonwealth Fund.