Download
1 / 10
100 likes | 277 Views
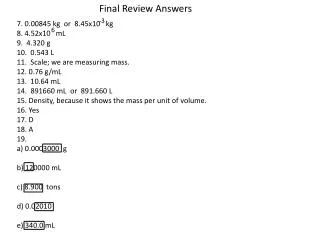
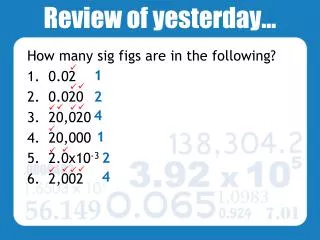
Warm Up # of sig figs 1.020 0.00410 120 144.0 4.0 x10 3. AP Physics Tuesday 14.09.02 Standards : Kinematics 1D & 2D: Big Idea 3 Learning Objective : SWBAT measure the acceleration due to gravity. Agenda: Warm Up Review HW Sig Figs Final Questions

E N D
Warm Up # of sig figs 1.020 0.00410 120 144.0 4.0 x10³ AP PhysicsTuesday 14.09.02Standards: Kinematics 1D & 2D: Big Idea 3Learning Objective: SWBAT measure the acceleration due to gravity. • Agenda: • Warm Up • Review HW • Sig Figs Final Questions • Lab: Measuring Gravity with a Ruler Homework KAP #2
Warm Up Find the average speed of a donkey running from a dog if it takes the donkey 2 minutes to run 1.3 km. AP PhysicsWednesday 14.08.26Standards: Kinematics 1D & 2D: Big Idea 3I –Independent Resilient IndividualsRST.11-12.9 Synthesize information from a range of sources into coherent understanding of a process, phenomenon, or concept,…Learning Objective: SWBAT collect data and find their reaction time using the fact that gravity accelerates objects downwards • Agenda: • Warm Up • Review HW KAP1&2 • Reflection: acceleration due to gravity lab • reaction time lab • 3. Homework KAP#3 Homework KAP#3
AP PhysicsThursday 13.09.04Standards: Kinematics 1D & 2D: Big Idea 3I –Independent Resilient IndividualsRST.11-12.9 Synthesize information from a range of sources into coherent understanding of a process, phenomenon, or concept,…Learning Objective: SWBAT collect data and find their reaction time using the fact that gravity accelerates objects downwardsLearning Objective: SWBAT analyze situations involving a constant acceleration Warm Up If you measure how long it takes for an object to fall 4 m, and you get 0.014s, but your reaction time is 0.15s, what can you say about the certainty of your measurement? Homework KAP#4 Agenda Warm up Review HW Review Reaction Time Lab
Warm Up Find the initial speed of an ostrich if it traveled 900 m while accelerating at 3 m/s2 and ended up traveling at a speed of 22 m/s. AP PhysicsFriday 13.09.05Standards: Kinematics 1D & 2D: Big Idea 3RST.11-12.4 Meaning of symbols, key terms, technical jargonProblem SolversObjective: SWBAT graphically represent displacement, velocity, and acceleration Agenda • Warm Up • Stamp HW • graphically representing velocity and acceleration lab Homework K#5
KAP #1 • Study Significant Figures from your book on your own. • Answer the following questions: pg. 19 9,10,11,13,14 • Come on Tuesday ready to ask questions (We do not have time to spend a whole class on them, so when studying significant figures you should be able to answer the following questions if you’ve done a good job. • What are they? What does the book mean by a significant figure? • When are significant figures used? • What benefits do using significant figures give to scientists and science students? • How are they used? (How do you use them in problem solving?)
kAP #2 • The fastest fish, the sailfish, can swim 1.2x10² km/h. Suppose you have a friend who lives on an island 16 km away from the shore. If you send a message using a sailfish as a messenger, how long will it take for the message to reach your friend? • An ostrich can run at speeds of up to 72 km/h. How long will it take an ostrich to run 1.5 km at this top speed? • A cheetah is know to be the fastest mammal on Earth, at least for short runs. Cheetahs have been observed running a distance of 5.50x10² m with an average speed of 1.00x10² km/h. • How long would it take a cheetah to cover this distance t this speed? • Suppose the average speed of the cheetah were just 85.0 km/h. What distance would the cheetah cover during the same time interval calculated in (a)? 4. The peregrine falcon is the fastest of flying birds (and, as a matter of fact, is the fastest living creature). A falcon can fly 1.73 km downward in 25 s. What is the average velocity of the peregrine falcon?
KAP #3 : • p. 46 • 1,,4,7,8, 11 • p.47 1, 3, 6
KAP #4 constant acceleration Problems • In 1986, the first flight around the globe without a single refueling was completed. The aircrafts average speed was 186 km/h. If the ariplane landed at this speed and accelerated at -1.5 m/s2, how long did it take fo the airplane to stop? • Some tropical butterflies can reach speed of up to 11 m/s. Suppose a butterfly flies at a speed of 6.0 m/s while another flying insect some distance ahead flies in the same direction with a constant speed. The butterfly then increases its speed at a constant rate of 1.4 m/s2 and catches up to the other insect 3.0 s later. How far does the butterfly travel during the race? • Stetching 9345 km from Moscow to Vladivostok, the Trans-Siberian reailway is the longest single railroad in the world. Suppose the train is approaching the Moscow station at a velocity of +24.7 m/s when it begins a cosntant acceleration of -0.850 m/s2 . This acceleration continues for 28s. What will be the trains final velocity when it reaches the station.
KAP #5 • AP Physics B FRQ on separate sheet.
Representing velocity and acceleration Graphically • Step 1: Repeat 2 of your most recent labs with slight modifications. • a) Tumblebuggy speed lab • b) Penny drop gravity lab • Modifications: Track the position of the car and penny as they move. You can do this using the lap feature on your phone. Do multiple trials and average them for better data. • Step 2: Record your data in tables. Create your own. In each table begin with displacement (m), time (s) • Step 3: Pick 5 points on your best fit curve of your displacement vs time graph and find the instantaneous velocity at that instant (slope of the tangent line). • Step 4: Graph velocity vs. time. • Step 5: Pick 5 points on your best fit curve of your velocity vs. time graph and find the instantaneous velocity at those points (slope of the tangent line) • Step 6: Graph Acceleration vs. time • Hint: You can check your work if you have a graphing calculator and you enter your displacement vs time data.