PHA 06: The life table
180 likes | 499 Views
PHA 06: The life table. John Powles 2009. Comparing mortality levels: metrics. Crude all cause mortality rates Inappropriate because sensitive to age structure Age standardised mortality rates Essentially (DASR): weighted averages of age-band specific rates Weights come from the standard

PHA 06: The life table
E N D
Presentation Transcript
PHA 06: The life table John Powles 2009
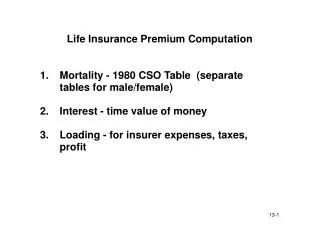
Comparing mortality levels: metrics • Crude all cause mortality rates • Inappropriate because sensitive to age structure • Age standardised mortality rates • Essentially (DASR): weighted averages of age-band specific rates • Weights come from the standard • World (old or new) • European • Equal weights (Peto – for ages 35-9 to 65-9)
Intelligibility of absolute values It is not easy to calibrate in one’s mind what a DASDR for males living in Cambridge in 2002 of 419 per 100000 person-years .... Actually means in terms of absolute mortality levels
(Average or Population) Risks Can be calculated directly from death rates using: risk = 1 – e-∑rt Or Read off Life tables
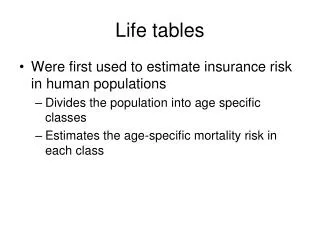
Life tables – a ‘time based metric’ of mortality These summarise mortality experience in a natural population by projecting it onto a hypothetical life table population Advantages • Yield parameters whose magnitudes are intelligible to the non-expert (eg ‘life expectancy’) • ‘Built in’ age-weighting reflects social values a given absolute increase in risk of death at an early age has several times the effect on life expectancy of the same absolute change at a higher age
Life tables – a ‘time based metric’ -2 They yield multiple, intelligible parameters eg survival curves, distributions of age at death etc ‘Templates’ can be implemented on spreadsheets and retained for re-use with different data
Life table construction Full life table: n = 1 ie 1 row for each year of life Abridged life table: n typically is 5 (except first 2 intervals, 0-1, 1-4)
Life table construction The ‘preliminary calculations’ Convert the central death rates (nMx) of all persons aged between x and x+n into a probability of dying between exact age x and x+n -> nqx
Life table notation nqxThe probability of dying between exact age x and age x+n (They are approximately 5 times the corresponding mx's because they cover a 5 year interval.) axThe average proportion of the age interval x to x+n lived by those who die in the interval. n The number of years in the interval. (This is 1 in a full life table, typically 5 in an abridged life table - except in early life.) lxThe number alive at exact age x. ndxThe number dying between x and x+n. nLxThe number of years of life lived between ages x and x+n. nTxThe total number of years of life lived (by the surviving birth cohort) after exact age x. exThe average number of years of life lived by those alive at exact age x. (eg e0 is life expectancy at birth.)
Exercise • Open the annotated life table and go to row 54 to follow the ‘guided tour’ of the life table template • Construct an abridged life table for males living in the East of England in 2002 • See handout