Download
1 / 39
390 likes | 560 Views
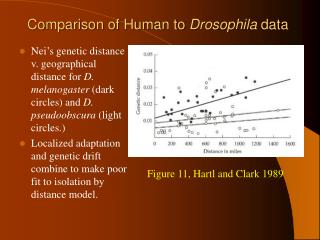
Modelling of high-frequency electrodeless lamps. Comparison to experimental data. N. Denisova , G.Revalde, A. Skudra Institute of Theoretical and Applied Mechanics, Novosibirsk, Russia Institute of Atomic Physics and Spectroscopy, University of Latvia, Riga, Latvia.

E N D
Modelling of high-frequency electrodeless lamps. Comparison to experimental data. N. Denisova, G.Revalde, A. Skudra Institute of Theoretical and Applied Mechanics, Novosibirsk, Russia Institute of Atomic Physics and Spectroscopy, University of Latvia, Riga, Latvia 12-16 April 2005, Madeira,Portugal
In this work, we present the results of investigations of high-frequency electrodeless discharge lamps (HFEDLs), developed as light sources for atomic absorption spectrometry. Ganeev A., Gavare Z., Khutorshikov V.I., Khutorshikov S.V., Revalde G., SkudraA., Smirnova G.M., Stankov N.R. 2003 Spectroch Acta B58 879-889. 12-16 April 2005, Madeira,Portugal
The light sources based on the principle of electromagnetic induction are receiving increasing attention due to their great promise in lighting technology. For optimization of this kind of light sources, a self-consistent modeling of physical processes in a discharge plasma and electromagnetic field parameters is necessary. Various methods of modeling inductive discharges have been developed. The developed models depend on the discharge pressure. In this work, the inductive discharges with the pressure of the order of 0.5-10 Torr are considered. Low-pressure inductive coupled plasma (ICP) sources are widely used in practice, which promotes a development of suitable models. 12-16 April 2005, Madeira,Portugal
Basic model assumptions: 1.The discharge is presented as a part of an infinitely long cylinder placed inside a solenoid. 2.The plasma is homogeneous along the axis and the discharge parameters depend on the radial coordinate. 3.The electrons are assumed to have a Maxwellian energy distribution function due to the relatively high electron density The electron energy distribution function is assumed to be isotropic, as the skin layer is thin. 12-16 April 2005, Madeira,Portugal
A self-consistent HFEDL model. The developed HFEDL model includes three basic blocks: 1.The collision radiative plasma module 2.The calculation of the electromagnetic field 3.The calculation of the spectral lines shapes and intensities The collision radiative module includes the necessary data base. The calculation of the electromagnetic field profiles is based on the Maxwell equations and is performed self-consistently with the plasma parameters. 12-16 April 2005, Madeira,Portugal
The electron density balance equation: The electron energy balance equation: The excited states balance equations: The electromagnetic field equations. 12-16 April 2005, Madeira,Portugal
High-frequency electrodeless dischargesin argon and krypton. Bulyshev AE, Denisova NV, Skudra A 1989 Optical characteristics of a high frequency electrodeless discharge in argon and krypton Optics and Spectr.67 788. Denisova N V, Preobrazhensky N G 1994 Spectrochimica Acta 49B 2 185-191
High-frequency electrodeless discharge lamps (HFEDLs) in helium Usually, one does not use helium for filling HFEDLs, due tothe high diffusion of the helium through the walls of the lightsource. The helium lamps that work for more than 1000 h were produced by Riga’s High Resolution Spectrometry Group at the Institute of Atomic Physics and Spectroscopy by a special technology. An optimization of such lamps, in the sense of performance for scientific and industrial applications, requires studying of fundamental properties of the high-frequency electrodeless discharge (HFED). 12-16 April 2005, Madeira,Portugal
The cylindrical HFEDs samples of 10 mm diameter and 40 mm length were used in experiments. The helium pressure was varied in the range from 0.2 to 7 Torr. An electromagnetic field of approximately 100 MHz frequency was used for the excitation of an inductively coupled discharge in the samples placed into the oscillator coil. The power of the HF discharge was varied by changing the coil current, from about 50 mA to 220 mA. 12-16 April 2005, Madeira,Portugal
The typical input HFED operating conditions, considered in this work, are the followings: • the gas pressure within the range 0.5 - 10 Torr, • 2) the external magnetic field amplitude 0.5-2oe and the frequency of the applied electromagnetic field 100MHz, • 3) the gas temperature 400 - 700K, • 4) the tube radius ~0.5-1 cm. 12-16 April 2005, Madeira,Portugal
ne*10 10 T, eV Pressure,Torr Pressure,Torr The electron temperature versus the gas pressure in the discharge. The electron density versus the gas pressure in discharge for two different values of the external magnetic field amplitude : 1oe and 0.7oe. 12-16 April 2005, Madeira,Portugal
Dependence of the electron density and temperature on the discharge tube radius. E, (a.u.) Ne Radius,cm Radius,cm Te,eV The electric field profile for two different values of the gas pressure p: (1) p=0.2 Torr, (2) p=1 Torr Radius,cm 12-16 April 2005, Madeira,Portugal
Numerical calculation Analytical estimation of the absorbed power The absorbed power versus the gas pressure for different values of the external magnetic field amplitude H0: H0=2oe, H0=1oe, H0=0.7oe. 12-16 April 2005, Madeira,Portugal
¹S ¹P ¹D ¹F ³S ³P ³D ³F 5 5 4 4 3 3 3 2¹P 2³P 2¹S 2³S 1¹S He 587.6nm 667.8nm 728.1nm 12-16 April 2005, Madeira,Portugal
Numerical calculation Experiment Experimental intensities of the 587.6 nm and 728.1 nm lines versus the gas pressure for two different values of the excitation generator current (1) 100mA, (2) 200mA. Calculated intensities of the 587.6 nm and 728.1 nm lines versus the gas pressure for two different values of the magnetic field amplitude H0: (1) H0=0.7oe, (2) H0=1.5oe. 12-16 April 2005, Madeira,Portugal
Experiment Numerical calculation Experimentally measured intensity of the 728.1nm line versus the generator current for different values of the gas pressure p: (1) p=0.35 Torr, (2) p=0.65 Torr, (3) p=1.35Torr, (4) p=2.2Torr, (5) p=3.15Torr, (6) p=5.1Torr. Calculated intensity of the 728.1nm line versus the external magnetic field amplitude for different values of the gas pressure p: (1) p=0.4 Torr, (2) p=0.6 Torr, (3) p=1Torr, (4 ) p=2 Torr, (5) p=3 Torr, (6) p=5 Torr. 12-16 April 2005, Madeira,Portugal
The line intensity profiles versus the radius. 667.8 nm 1 – H = 0.7 oe, 2 – H = 1.5 oe Experimental data: A.Skudra ‘High-frequency electrodeless helium lamps’,Acta universitatis Latviensis, 573,Riga,1992. 12-16 April 2005, Madeira,Portugal
Conclusion. An improved self-consistent model of the high-frequency electrodeless discharge lamps in helium is developed. Based on the model, the emission properties of the helium lamps are calculated, being in a good agreement with the experimental data. The developed model is used to obtain optimal operation conditions of high-frequency electrodeless helium lamps. 12-16 April 2005, Madeira,Portugal
High-frequency electrodeless lamps in argon-mercury mixtures. Numerical and experimental investigations of high-frequency electrodeless lamps in argon- mercury mixtures are performed. The intensities of the mercury spectral lines of the wavelengths and the resonance line are measured at a wide range of mercury pressures varying the HF generator current and argon filling pressure. A stationary self-consistent model of high-frequency electrodeless discharge lamp is developed including kinetics of the excited mercury and argon atomic states. Based on the developed model, the radiation characteristics of the discharge plasma are calculated. Calculations of the relative intensities of the visible triplet lines are presented first in this work. 12-16 April 2005, Madeira,Portugal
3.2. Elementary processes. 1. Ionization by electron collisions. The ionization rate coefficients of the ground state (curves 1), the levels - (curves 2) and (curve 3). The circles indicate the calculations in accordance with the semi-empirical formulas [14], diamonds correspond to the data, given in [13] (curve 1) and [5,15] (curves 2,3). Rockwood S.D. 1973 Phys.Rev. A8 2348. Drawin H W, Emard F 1975 Beitr.Plasmaphys.15 273. Vriens M.L., Keijser R.A.J., Lighart F.A.S. 1978 J.Appl.Phys.49 p.3807-3813. 12-16 April 2005, Madeira,Portugal
2. Ionization by heavy particles collisions. Vriens M.L., Keijser R.A.J., Lighart F.A.S. 1978 J.Appl.Phys.49 p.3807-3813. 3. Penning ionization. Phelps A.V., Molnar J.P. 1953 Phys.Rev. 89 1202. 4. Radiative transitions. Radzig A.A., Smirnov B.M. 1980 Reference book on atomic and molecular physics Moscow Atomizdat p.240. Wiese W L, Smith N W, Glennon B M 1966 Atomic Transition Probabilities NBS Report NSRDS4. The effect of radiation imprisonment was taken into account by using an escape factor. 12-16 April 2005, Madeira,Portugal
Curve 1 Curve 2 Curve 3 5. Excitation/de-excitation by electron collisions. Vainstein L.A., Sobel’man I.I., Yukov E.A. 1979 Atoms excitation and spectral lines broadening Moscow Nauka p.319. Winkler R.B., Wilhelm J., Winkler R. 1983 Annalen der Physik p.90-139. 12-16 April 2005, Madeira,Portugal
A schematic energy level diagram of the mercury atom Biberman L M, Vorob’ev V S, Jakubov I T 1982 Kinetics ofnon-equilibrium low temperature plasmasNauka Moscow. J.van Dijk, B.Hartgers, J.Jonkers, J.A.M.van der Mullen 2000 J.Phys.D: Appl.Phys.33 p.2798. 12-16 April 2005, Madeira,Portugal
Numerical calculations of plasma parameters and emission properties of HFEDL. Comparison to experiment. Curves1-P Ar=1Torr, curves2 – P Ar=2Torr, curves 3 – P Ar=3Torr H0=0.7oe Curves 4 – P Ar=2Torr, H0=0.9oe 12-16 April 2005, Madeira,Portugal
a b The comparison the partial contributions of the different ionization processes for the two different argon filling pressures: a – 2Torr, b – 1Torr. 12-16 April 2005, Madeira,Portugal
The comparison of the measured and calculated emission intensities of the visible triplet lines Solid line – numerical calculation, circles –measured data. Calculated data are normalized to the measured data at . Argon filling pressure . 12-16 April 2005, Madeira,Portugal
The basic physical model and numerical codes of the high-frequency electrodeless discharge lamp (HFEDL) used for spectroscopic applications are developed. The model was tested in our previous works for argon and helium lamps. In the present paper, this model is tested by comparing numerical calculations to the results of experimental data for the argon-mercury lamp. Based on the developed model, the radiation characteristics of the HFEDL are calculated. Numerical simulation of behavior of the line intensities in dependence on the external discharge parameters is performed and is found to be in qualitative agreement with the experimental data. Calculations of the emission intensities corresponding to the visible triplet of mercury atom are presented first in this work. The intensity of the resonance line 253.7nm versus the cold spot temperature. Dashed line – numerical calculation, points – experimental data. The numerical and measured results are normalized at the maximum. 12-16 April 2005, Madeira,Portugal
Conclusion. The basic physical model and numerical codes of the high-frequency electrodeless discharge lamp (HFEDL) used for spectroscopic applications are developed. The model was tested in our previous works for argon and helium lamps. In the present paper, this model is tested by comparing numerical calculations to the results of experimental data for the argon-mercury lamp. Based on the developed model, the radiation characteristics of the HFEDL are calculated. Numerical simulation of behavior of the line intensities in dependence on the external discharge parameters is performed and is found to be in qualitative agreement with the experimental data. Calculations of the emission intensities corresponding to the visible triplet of mercury atom are presented first in this work. 12-16 April 2005, Madeira,Portugal
Radial properties of high-frequency electrodeless lamps in argon-mercury mixtures. Experimental set-up for the measurement of the radial distribution of the intensities. Mirrors 1, 2, 3 are mounted on the common holder and the moving the mirrors in the necessary direction performs the scanning of the radial emission from the cylindrical spectral lamp. The dotted line shows the place of the mirrors and the rays after displacement of the mirrors. 12-16 April 2005, Madeira,Portugal
Experiment Numerical calculation . Argon pressure: , mercury pressure: . 12-16 April 2005, Madeira,Portugal
Experiment Numerical calculation 12-16 April 2005, Madeira,Portugal
Experiment Numerical calculation 12-16 April 2005, Madeira,Portugal
Conclusion. 1.The basic physical model and numerical codes of the high-frequency electrodeless discharge lamp (HFEDL) used for spectroscopic applications are developed. The model has been tested for argon, krypton, helium and argon-mercurylamps. 2. Numerical simulation of the line intensities behavior in dependence on the external discharge parameters is performed, being in qualitative agreement with the experimental data. 3. Based on the developed model, the radial dependences of radiation characteristics of the HFEDL are calculated. 4.Calculations of the emission intensities corresponding to the visible triplet of mercury atom are presented first in this work. This work was supported by INTAS grant 01-0200 12-16 April 2005, Madeira,Portugal
Monte Carlo simulation of radiation trapping in Hg-Ar HF EDL. The line shape in the chosen direction is determined Using the Biberman equations: and integral operator: the solution can be presented in the form of Neumann series: 12-16 April 2005, Madeira,Portugal
Experiment Monte Carlo modelling 12-16 April 2005, Madeira,Portugal
Computed tomography for discharge plasma diagnostics Computed tomography is a powerful tool for discharge plasma diagnostics. Unfortunately, viewing access in many plasma experiments is strongly limited, which leads to a highly underdetermined ill-posed problem. A Maximum a Posteriori (MAP) reconstruction algorithm is developed which yields the most probable image estimate from limited and noisy data. ART reconstruction Exact model MAP reconstruction 12-16 April 2005, Madeira,Portugal
Maximum a Posteriori reconstruction method for plasma tomography. N.Denisova Institute of Theoretical and Applied Mechanics, Novosibirsk, 630090, Russia e-mail:denisova@itam.nsc.ru . Abstract Computed tomography is a powerful tool for plasma diagnostics. Unfortunately, viewing access in many plasma experiments is strongly limited, which leads to a highly underdetermined ill-posed problem. A Maximum a Posteriori (MAP) algorithm is a promising statistical approach to this problem. In this paper, we study the MAP algorithm which yields the most probable image estimate from limited and noisy data. An adaptive chi-square statistical criterion is proposed to control the quality of reconstruction. An improvement in reconstruction image quality over conventional tomographic methods, such as the algebraic reconstruction technique (ART) and Maximum Entropy (ME) algorithm, is illustrated by several numerical examples. Introduction Plasma sources, playing an important role in various technical applications are usually inhomogeneous objects. A better understanding of physical processes occurring in a plasma and optimization of plasma sources performance require knowledge of their spatial properties. Optical diagnostics of plasma sources are performed usually by measurements of integral characteristics along lines passing through a plasma object. For instance, the emitted intensity of plasma radiation is a line integral of the local emission coefficients and the absorbed intensity is an integral of the local absorption coefficients. The emission and absorption coefficients are directly related to the spatial distribution of atoms or ions in the excited and in the ground states. In interferometric measurements, the plasma-produced phase shift is related to the integral of the electron density along the line of sight. Local plasma properties (images) can be derived from the integrated data by combining of an integrating measurement techniques and computer tomography algorithms and methods. This can provide much useful information on the plasma structure and its evolution in time. The computed tomography is receiving increasing attention as a powerful method for the reconstruction of the local characteristics in both: high-temperature and low-temperature plasma sources [1-3]. Tomographic technique is better developed for the reconstruction of the local soft x-ray emission in high-temperature plasmas. As to the low-temperature plasma sources, the majority of investigations deal with an assumption that the plasma possesses axial symmetry so that local characteristics may be recovered by Abel inversion. Violation of this symmetry is often observed in real plasma experiments. Various algorithms are developed in order to get as much details as possible in the reconstructed image. The number of views in plasma experiments is usually small because of limiting access and complexity of the diagnostic system. From a theoretical point of view, reconstruction with limited data is a highly underdetermined ill-posed problem. There are various theoretical approaches on the development of algorithms for obtaining image estimates, such as Algebraic Reconstruction Technique (ART) [5], Maximum Entropy method [3,4], minimum Fisher information algorithm [6], constrained optimization [7] and Maximum a Posteriori (MAP) methods [8]. These algorithms are intended to be applied in different class of reconstruction problems corresponding to different kinds of prior and different kinds of data. It is known, that ART suffers from the presence of artifacts in reconstruction with limited data. Recently developed algorithm, based on the Fisher information concept, was successfully applied for the soft x-ray tomography on the TCV tokamak. A promising approach to the plasma tomography problems is the Maximum Entropy (ME) algorithm. ME seems especially attractive in the case when the number of views is strongly limited. Based on our previous experience with the ME [9,10], we concluded that this algorithm is excellent for ideal (noiseless) data or the data with a low level of noise. However, experimental data practically always are hampered by the presence of noise. A solution of ill-posed problem is known to be very sensitive to the level of noise. A preprocessing procedure should be applied to smooth the noisy data. Unfortunately, some useful information may be lost by applying the smoothing procedure. An alternative approach is to take into account stochastic properties of the measured data. The Maximum a Posteriori (MAP) method combines the possible prior information about a source function and the condition probability low, which characterizes statistical properties of errors in the data. The MAP algorithms are widely used in medical emission tomography. In contrast to the medicine tomography, the number of views in plasma experiments is limited. In this paper, the MAP algorithm with entropy prior (MAP-ENT) is studied numerically in condition with limited data. The relation between Maximum Entropy and MAP-ENT approaches is analyzed. An adaptive chi-square statistical criterion is proposed to control the quality of reconstruction. An improvement in reconstruction image quality over conventional tomographic methods, such as the algebraic reconstruction technique (ART) and Maximum Entropy (ME) algorithm, is illustrated by several numerical examples. Theory. Reconstruction of a source function from its projection data is known as an ill-posed problem, which can be presented in the framework of linear operators in the following way (1) where and are elements of linear spaces and , and is a linear operator . The projection data are usually a realization of some random process. In this case, operator is invertible with not continuous, then need not be close to the ideal solution even if is close to . It is the situation in which the ill-posedness of the reconstruction problem actually lies. There are two different approaches for solving ill-posed problems: deterministic and statistical methods. In practice, the deterministic methods provide often the excessively smoothing solutions because these methods allow one to control the upper limit of error only. But the random error is usually smaller than its maximum value. Therefore, it is more natural to consider ill-posed problems by using statistical properties of the errors. A general statistical approach is based on the Bayes’ theorem. Suppose that the unknown quantities describe the state of an object to be reconstructed. The experiment provides the projection data that are random quantities . The condition probability law, , which characterizes the statistical properties of the errors, is assumed to be known. By using the standard Bayesian approach [11], the posterior probability of the distribution with the given data is determined as (2) where is a prior probability density. The most probable (Maximum a Posteriori) image estimate is obtained by maximizing . In logarithmic form, it can be written as follows: (3) According to this formula, the MAP estimate of with the given data is determined both by the prior information about the source function and by the kind of the data we have. The role of entropy in determining the prior probability was discussed in details in [12,13]. The entropy-based prior information is successfully applied for restoration of images [11,13] and in plasma tomography [3,6]. From a physical point of view, the entropy concept provides the optimal prior in the situation when the researcher knows a priori only the fact that emitting (absorbing) particles obey Boltzmann statistics. In this sense, plasma is ideally suitable for using the entropy approach: photons are emitted (absorbed) by the atoms, which behave like ‘classical’ particles and, consequently, obey Boltzmann statistics. The entropy-based prior probability provides the solution, which can be combinatorily formed in the most number of ways and is usually written as follows: (4) where is a constant associated with a relation between the density of emitting (absorbing) particles and the number of emitted (absorbed) photons. The condition probability is assumed to be a Gaussian likelihood function. In the logarithmic form, it is written as follows: (5) where is the detection probability matrix, is the standard deviation. Substituting (4) and (5) into (3) gives us the Maximum a Posteriori estimation (ignoring all factors independent of ) (6) where plays the role of a regularization parameter. It is worth saying a few words about the relations between the MAP and some other reconstruction methods in the context of Bayesian approach. Various kinds of priors are proposed, corresponding to different reconstruction problems. The usual direct solution of the Eq.(1) without regularization by the ART and similar methods can be considered as the Bayesian solution for the prior probability . When the data are complete and of good quality, the conditional probability is much more informative item in Eq.(3) and these methods can provide good reconstructions. However, in situations with limited data, one should expect poor reconstruction by the ART algorithm. When the data are noisy and limited, prior information can be as much weight as the data. There are two different approaches with using prior information: the Maximum a Posteriori algorithms and the constrained algorithms. A difference between these approaches is as follows: in the MAP algorithms, the data enters as a part of quantity to be maximized, . With the constrained method, the data are added via Lagrange multipliers exterior to the prior probability to be maximized or minimized. The constrained algorithms are the Maximum Entropy, constrained optimization, minimum Fisher information. At that, the data in the Maximum Entropy approach may be presented in different forms: ideal projection data as in [4,9,10] or by using the statistical chi-square criterion as in [3,6]. From the point of view of Bayesian approach, MAP algorithms provides most probable solution if compare with constrained methods, especially in the situations with noisy data. Adaptive chi-square criterion. When solving ill-posed problems numerically one needs to have a criterion to control and stop the iteration process. Stopping rule based on the chi-square hypothesis was proposed in [14]. The rule is based on testing whether the resulting image is ‘feasible’ in a statistical sense. Any result that falls within the interval is considered to be a feasible solution. In this paper, an adaptive chi-square criterion is applied to control the convergence properties of the MAP algorithm. The adaptive chi-square criterion is calculated using the usual mathematical form, with the exception that it is applied to the selected pixels of the given data rather than to the whole data. (7) where is the number of selected pixels of the data, are the projection data, is an element of the image estimate, is the detection probability matrix. Usually one seeks within a range , because this establishes a 95% confidence interval on the feasibility criterion. A standard criterion includes all the data with . However, reconstruction errors in low-count regions of the image lead to a considerable error in the calculation of the function. To provide a more correct criterion, one needs to exclude the data with a low statistics. The adaptive criterion is in setting a simple threshold on the minimum value of the data detected in a pixel. In numerical calculations, the value was defined by analyzing the projection data and pseudo-projection data . Numerical tests of the MAP algorithm. To evaluate the approach, 2D reconstructions were investigated. Input data were chosen to simulate real situations in diagnostic experiments with a limited number of views. The main goal is to compare the MAP algorithm with conventional reconstruction methods. With that end in view, two examples of reconstructions with limited and noisy data were analyzed. The first example of a plasma source, shown in Fig.2(a), simulates soft x-ray tokamak plasma emissivity, close to that presented in [2,6]. Of course, in numerical calculations we do not reproduce all details of data acquisition in real experiments – this is a question for special consideration. The geometry of the reconstruction problem is shown in Fig.1. The reconstruction is performed on a normalized square region of , which is divided into pixels. The dashed circle demonstrates the reconstruction area. In numerical calculations, the parallel scheme of data acquisition is used. The exact projection data were calculated analytically. The data were produced from 6 projection angles spaced around the plasma object as shown in Fig.1. 201 detectors (parallel beams), which cover entirely the reconstruction area, were used for the first view. For other 5 views, the situation with restricted access was simulated. The data from only 170 detectors were used at each view for reconstruction instead of 201 detectors. A 3% Gaussian noise was added to the exact data. Fig. 2(b) shows the reconstructed image using the MAP algorithm. For comparison the reconstructions of the same source function by the ART and ME algorithms are shown in Figs.2(c) and 2(d), respectively. These reconstructions were performed with full access: the data from 201 detectors were used for calculations at each view. Nevertheless, the ART reconstruction is completely unrecognizable. The ME reconstruction also suffers from the presence of noisy artifacts. At the same time, MAP reconstruction demonstrates detailed spatial structure of the plasma source. Comparing the reconstruction images presented in Figs.2(b)-2(d) one can see that the MAP reconstruction is most closer to the exact model. The convergence properties of the MAP algorithm were investigated. Fig.3 demonstrates the deviation from the target chi-square versus iteration number. The deviation from the target chi-square of Eq.(7) is considered to be a function characterizing the reconstruction error and, hence, the quality of reconstruction. Any result that falls within the feasibility interval is considered to be a feasible solution. Fig.4 shows the mean-square error of reconstruction as a function of the iteration number. The reconstruction error was defined as the mean-square norm of deviation of the reconstruction solution from the exact one : (8) Curves 1,2,3 in Fig.4 correspond to the ART, MAP and ME reconstructions, respectively. It is seen, that MAP and ME solutions have approximately equal errors of reconstruction, though they differ by sight. Comparing the results presented in Figs.3 and 4 (curve 2) one can see, that the chi-square criterion is in a good agreement with the mean-square error characteristic. In a real experimental situation, a researcher can’t estimate the mean-square error of reconstruction because the exact solution is unknown. But the chi-square function can be estimated at each iteration step. Thus, the chi-square function may be used as a criterion of the quality of the reconstructed image. The second example of a plasma source is shown in Fig.5(a). It simulates a spatial distribution of ion emission coefficients of a powerful optical pulsating discharge (POPD) [15] in a transverse gas flow. A 5% Gaussian noise was added to the exact data. Reconstruction was performed by using only two perpendicular views with the angles and Two-view tomography of the plasma optical pulsating discharge in a high-velocity flow of argon Grachev G.N.,Denisov V.I.,Denisova N.V., Menshikov J.G., Smirnov A.L. 12-16 April 2005, Madeira,Portugal Fig.2(a) Fig.2(b) Fig.2(c) Fig.2(d) iteration Fig.3 1 2 3 iteration Fig.4 Fig.5(a) Fig.5(b) Fig.5(c) Figures captions Fig.1.Detectors and views geometry used in the calculations. 6 views with parallel scheme of data acquisition were used in reconstructions. (Views 3 and 5 are not shown in the picture.) Dashed circle demonstrates the reconstruction area. Fig.2. (a) The original source; (b) reconstruction by the MAP algorithm; reconstruction geometry is demonstrated in Fig.1; (c) reconstruction by the ART algorithm; (d) reconstruction by the ME algorithm. Fig.3. Deviation from target value of the chi-square Fig.5(d) versus iteration number for the MAP reconstruction. Dashed lines show the feasibility interval. Fig.4. Mean-square error of reconstruction versus iteration number. Curves 1, 2 and 3 correspond to the reconstructions by ART, MAP and ME algorithms, respectively. Fig.5. (a) The original source; (b) reconstruction from 2 views with parallel beam geometry by the MAP algorithm; (c) reconstruction by the ART algorithm; (d) reconstruction by the ME algorithm.
1. Denisova N V 1998 Maximum Entropy based tomography for gas and plasma diagnostics J. Phys. D: Appl. Phys. 31 1888. • 2. Denisova N V Two view tomography 2000 J. Phys. D: Appl.Phys. 33 313. • 3. Denisova N V A maximum a posteriori reconstruction method for plasma tomography 2004 Plasma Sources Sci.Technol. 14 531. 12-16 April 2005, Madeira,Portugal