Download
1 / 21
210 likes | 324 Views
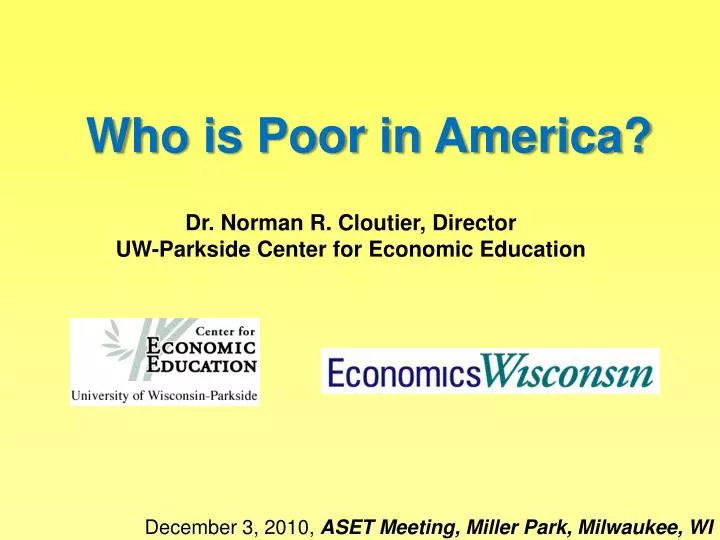
Who is Poor in America?. Dr. Norman R. Cloutier, Director UW-Parkside Center for Economic Education. December 3, 2010, ASET Meeting, Miller Park, Milwaukee, WI. Societal Economic Goals. Low Unemployment Economic Growth Low Inflation Efficiency Equity. Adam Smith on Equity.

E N D
Who is Poor in America? Dr. Norman R. Cloutier, Director UW-Parkside Center for Economic Education December 3, 2010, ASET Meeting, Miller Park, Milwaukee, WI
Societal Economic Goals Low Unemployment Economic Growth Low Inflation Efficiency Equity
Adam Smith on Equity “However selfish a man may be, there are evidently some principles in his nature, which interest him in the fortunes of others, and render their happiness necessary to him, though he derives nothing from it except the pleasure of seeing it. We feel pity or compassion when we see the misery of others…” − Adam Smith, paraphrased from the opening paragraph of Theory of Moral Sentiments (1759) “By necessaries I understand, not only the commodities which are necessary for the support of life, but whatever the custom of the country renders it indecent for creditable people, even of the lowest order, to be without.” − Adam Smith, Wealth of Nations (1776)
U.S. Poverty Rate 1971—2009 25.8 25.3 43.6 million people 14.3 9.4
Single mothers increase their chances of living in poverty 416% relative to married couples
High school dropouts increase their chances of living in poverty by 529% relative to a college graduates
Not working increases the chances of living in poverty 741% relative to those who are working full-time
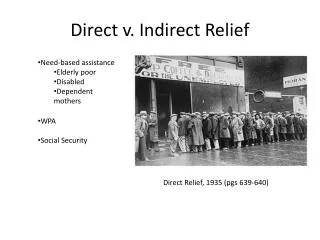
Measuring Poverty “. . . you can’t solve a problem until you can measure it.” “It is not too strong a statement to say that, 45 years after they were developed, the official poverty thresholds are numbers without any valid conceptual basis.” - Senator Daniel Patrick Moynihan • Dr. Rebecca Blank (Brooking Institution), testimony before the House Ways and Means Subcommittee on Income Security and Family Support Hearing on Establishing a Modern Poverty Measure Committee, July 17, 2008
What is the official U.S poverty rate actually measuring? • A person is in “poverty” if he or she lives in a family that has an income below a poverty threshold. • Calculate your poverty threshold for a family of four, two adults and two children.
How are the official poverty thresholds determined? • Mollie Orshanky’s 1963 original measures: • At the time, no budgets established except food • (food budget) x 3= threshold • Adjusted over time by the CPI-U. • Initially, the terms “poor” and “poverty” were not used in official government statistics. • normative vs. positive language
Problems with the official poverty statistic • No geographic distinctions • The CPI-U overstates inflation • Measured income is pre-tax • In-kind transfers are not counted • Should we count Medicaid and S-CHIP payments as income?
Problems with the official poverty statistic • Should the unit of analysis be the “family” or the “household”? • In 1992, counting household income would have resulted in 1.6 million fewer poor. • Counting all possible sources of income, but using current official thresholds, could decrease measured poverty by 36%. • 2007: official=12.5%, adjusted= 7.9%
Threshold Problems • Surveys have indicated that the general public would set thresholds 60%-70% higher than the official level. • In the early-1960s Orshansky assumed families spent 1/3 of the their income on food. Today it is closer to 1/7. • 1/3 yields a multiplier of 3 • 1/7 yields a multiplier of 14
Threshold Problems • Thresholds should incorporate explicit budgets for clothing, shelter, child care, personal care, transportation, household supplies. • Within region cost-of-living differences? • Equivalence scales • Economic Policy Institute “basic family budgets” • Madison, family of four= $52,019
Supplemental Poverty Measure • Due for release fall 2011. • Modeled after the 1995 National Academy of Sciences (NAS) recommendations. • Primus (2006) found in the 1990s: • Official rate declined 11.7%. • NAS adjusted rate declined 27.1%.
Characteristics of New SPM • Calculating the Threshold • Will use “household-type” unit of analysis rather than family. • Establish explicit budgets for food, shelter, clothing, and utilities (FSCU). • Adjustment for homeownership • Allow for geographic differences in housing costs • Region • Urban vs. Rural • Adjustment factor of 1.20
Characteristics of New SPM • Measuring Available Resources (income) • Add: • All (non-medical) in-kind benefits • Income from household members. • Tax credits (EITC) • Subtract: • Taxes • Work expenses, including childcare • Out-of-pocket medical expenses
Is the New SPM a Measure of Poverty? • Establishment of “typical” FSCU budget of the 33rd percentile household. • Relative vs. absolute measure • Consumption-based measure? • Material well-being is derived from the consumption of goods and services, not income per se. • Reported consumption tends to be higher than reported income.