Download
1 / 25
250 likes | 466 Views
The Role of Boundary Layer Circulations in Convection Initiation. Michael S. Buban *. 11/05/09. *Cooperative Institute for Mesoscale Meteorological Studies (CIMMS) School of Meteorology, University of Oklahoma, Norman OK NOAA/National Severe Storms Laboratory, Norman OK.

E N D
The Role of Boundary Layer Circulations in Convection Initiation Michael S. Buban* 11/05/09 *Cooperative Institute for Mesoscale Meteorological Studies (CIMMS) School of Meteorology, University of Oklahoma, Norman OK NOAA/National Severe Storms Laboratory, Norman OK
Importance of CI forecasting • Thunderstorms produce a variety of high-impact weather (e.g. tornadoes, hail, high wind, flooding rain, lightning). • A great deal of time and money has been dedicated to improving forecasts of thunderstorms and their attendant severe weather threats. • A primary forecasting challenge is to determine where, when, or whether or not convection will develop. • During the late spring and early summer of 2002 the International H20 project (IHOP) was conducted to document the 3-D evolution of water vapor in the atmosphere with the hopes of improving CI and quantitative precipitation forecasts.
Background – Parcel Theory • Air is viewed as a “parcel” which moves according to several “rules”: 1) No air is exchanged through the parcel boundaries (no mixing). 2) The potential temperature and water vapor mixing ratio remain constant during dry adiabatic motions. 3) The temperature decreases at the dry adiabatic lapse rate (9.8 K/km) during unsaturated ascent. 4) The temperature decreases at the moist adiabatic lapse rate (as a function of T, p, qv) during saturated ascent.
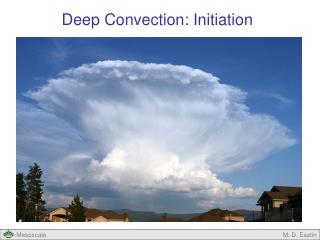
Background – Soundings • The initially unsaturated air rises dry adiabatically (red) from near the surface to the LCL. • During dry adiabatic ascent the temperature decreases and RH increases. • Above the LCL air rises moist adiabatically (blue). Adapted from Weiss and Bluestein (2002) • To reach the LFC air must rise above the capping inversion (CIN) • Above the LFC the air parcels, now warmer than their environment, will continue to rise driven by buoyancy forces, realizing CAPE.
Parcel theory - shortcomings • Mixing due to both coherent turbulence and viscous effects is neglected between the parcel and the environment during transport. • Mixing can substantially alter the scalar (I.e. T,qv,qc,etc.) and momentum properties of a parcel, especially in regions where strong gradients of these fields exist. • Sounding analysis of CAPE, CIN, etc. is 1-Dimensional, the real atmosphere is 4-Dimensional. • In the vertical, air within an updraft is a mixture from many different levels • The atmosphere is a continuous fluid that obeys highly non-linear equations - initial uncertainties amplify in time (chaos) and changes in the state of the system further change the state of the system (feedbacks).
CI – Getting air to the LFC • To initiate deep moist convection a quantity of air must reach its LCL and LFC. How does this occur? • Near surfaceair can be heated (insolation/conduction) becoming less dense than its surroundings and (assuming minimal cap) rising to its LCL/LFC due to buoyancy alone. Does this ever happen? • Air can be forced to its LCL/LFC by a vertical pressure gradient. • Vertical pressure forces may develop due to a variety of boundary layer features and exist across many scales.
CI – Fronts • Fronts are defined as the transition zone between two air masses with different densities. Typically the density difference is primarily due to temperature. • Frontal zones may extend hundreds of kilometers in the along-line direction and contain density gradients only several km wide across the front. • Density differences create solenoidally forced circulations within the frontal zone, with enhanced low-level convergence and vertical motion. • The strength of the frontal circulation is modulated by the strength of the density gradient and the local LFC relies on the thermodynamic state of the air within the frontal zone.
CI – Drylines • The dryline is a moisture gradient separating warm, moist air flowing off the Gulf of Mexico from the hot, dry air originating over the SW US. • Extending as much as several hundred km in the N-S direction, across-dryline gradients may be only 1 km or less. From Ziegler and Rasmussen (1998) • Like fronts, drylines frequently develop solenoidally forced circulations, with low-level convergence and enhanced vertical motion. • Density gradients are typically weaker than for fronts and are due to a combination of small temperature differences and larger moisture differences between air masses.
CI – Non-frontal boundaries • Other non-frontal near-surface boundaries can also force air to the LFC. Some examples: • Sea/lake breeze boundaries owing to differential heating over land and water. • Outflow boundaries from previous precipitation. Density gradients occur due to the temperature difference between the rain cooled and ambient air. • Boundaries due to topographical effects, differences in vegetation, differences in soil moisture, etc. • Although caused by different effects, boundaries are dynamically similar, featuring low-level convergence and enhanced vertical motion - to varying degrees.
CI or no CI • The strength of the density gradient across the boundary controls the intensity of the updraft. • The local thermodynamic state and source region of air within the updraft will affect the parcel LFC height. • Parcels must reach the LCL/LFC prior to leaving the mesoscale updraft (Ziegler and Rasmussen 1998). From Weckwerth and Parsons (2006) • Boundary orientation and interaction with the ambient vertical shear can produce updrafts more or less favorable for CI. • CI is dependent on the amount of CIN to overcome, the effects of updraft entrainment, and other along-line variability.
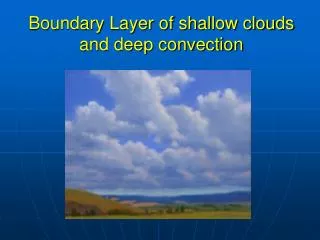
CI – BL convection • Buoyancy driven circulations may arise in the CBL allowing parcels to reach their LCL/LFC • The linearized equations of motion under certain conditions admit solutions in several forms (e.g. rectangular or hexagonal open convective cells, horizontal convective rolls, etc.) From Brown (1980) • Most frequently the CBL exhibits combinations of several modes of convection. • Although updrafts with this dry convection may reach values similar to those along strong boundaries, they generally do not penetrate far above the CBL top and generally initiate convection only in weakly capped environments.
CI – boundary interactions • The intersection of two boundaries (“triple point”) has been shown to be a preferential region for CI. • The circulation from one boundary may be lifted over the intersecting boundary. From Weiss and Bluestein (2002) • Enhanced vertical motion may result when the updrafts of the two boundaries are in phase. • Intersections may be between any two boundaries. For example: cold front/dryline, dryline/outflow boundary, front/HCR, etc.
CI – Misocyclones • In recent years some attention has been focused on the presence of small-scale (~1-3 km) vortices or misocyclones which have been observed to propagate along boundaries. • Originally their importance seemed to be mainly in relation to non-supercell tornadogenesis, but recent studies have shown them to play a potentially important role in CI. • Especially when boundary secondary circulations are weaker, interactions of misocyclones with the boundary may provide enhanced regions of frontogenesis and vertical motion. • Misocyclones are coherent structures, tend to move with the mean BL flow, and can last for substantial periods of time (30 min. or more), increasing their effect on local air parcels.
Misocyclone observations Marquis et al. (2007) - 3 June 2002 Pietrycha and Rasmussen (2004) - 10 June 1999 • Misocyclones were observed along the dryline in west Texas by analyzing mobile mesonet transects. • Misocyclones were observed in multiple-Doppler radar analyses along a cold front in the eastern Oklahoma panhandle.
Misocyclone observations - 2 Marquis et al. (2007) - 19 June 2002 Arnott et al. (2006) - 10 June 2002 • Misocyclones were observed along a cold front and a dryline in western Kansas using multiple-Doppler radar data. • Misocyclones in different cases behave similaraly as they track along the boundaries.
Drylinemisocyclones - airflow W (ms-1) • A wave moves northward along the DL with the misocyclone remaining located near its inflection point. • The misocyclone location also corresponds to the intersection of the DL with a longitudinal HCR extending upstream into the dry air. • Both the DL and the vortex show surprisingly little evolution over 9 minutes. • The misocyclone has a maximum vertical vorticity on the order of 9 x 10⁻³ s-1 Buban et al. (2007) - 22 May 2002
Simulations - Motivation • Detailed analyses of boundary layer features were made possible using high-resolution observations obtained during the IHOP field project. • These analyses however, are still lacking the spatial and temporal resolution to fully understand the dynamics governing the initiation and evolution of small-scale circulations such as misocyclones. • Using a numerical model allows for the simulation of BL features on very fine scales in space and time. • Simulations give a complete and internally consistent data set across many scales from which features of interest can be analyzed.
Model Description • The nonhydrostatic, cloud resolving Collaborative Model for Multiscale Atmospheric Simulation (COMMAS) was used to simulate the dryline and surrounding environment on 22 May 2002. • The model employs 3rd order advection and a 1.5 order subgrid-scale turbulence parameterization. Surface fluxes were calculated with a modified version of the Deardorff (1978) force-restore land surface/atmosphere exchange model. • Inflow boundary conditions were obtained by spatially and temporally interpolating the 9-minute spaced Lagrangian analyses (for thermodynamic variables) and 3-minute spaced multiple-Doppler analyses (for u and v momentum). • The simulation was run on a 30 km x 30 km x 6km grid with a 200 m horizontal grid spacing and stretched vertical grid spacing using a 15 m deep lowest layer.
Simulated horizontal qv 2300 2309 • Overall larger scale structure such as dryline orientation and moisture gradient similar to the observational analyses. • BL west of the dryline develops structures such as HCRs and open convective cells. 2318 2327 • Simulation develops smaller scale structures not resolvable in the observational analyses. • Misocyclones develop and propagate northward along the dryline.
Simulated qv cross-sections 2300 2320 • Simulation produces strong secondary circulation along the dryline and roll circulations west of the dryline, as seen in the radar analysis wind fields. • Smaller-scale plumes of moisture both east and west of the dryline develop as inclusion of a radiation and surface flux scheme allow instability near the surface to arise. • Magnitudes of the sensible and latent heat fluxes in the model are consistent with those measured by flux sensors in the domain.
Simulated qv - qc surfaces • Deeper moisture plumes produce clouds along and east of the dryline. • West of the dryline higher based cumulus develop along convergence bands. • Moisture fields are modified due to the presence of misocyclones along the dryline. • Forcing the model with radar analysis winds at the inflow boundaries produces similar momentum structures in the interior as seen in the individual radar analyses.
Simulated DL misocyclones 2303 2306 • Perturbations in the radar wind analyses introduced at the lateral inflow boundaries amplify downstream and produce misocyclones. • The misocyclones produced in the model are similar kinematically to those in the radar analyses but with smaller-scale structure. 2309 2312 • Misocyclones acting on the moisture fields produces structures not resolvable in the observational analyses and maximum vertical vorticity values are 2-3 times greater than in the radar analyses.
Simulated vortices - surfaces • Misocyclones act on the moisture field producing local perturbations. • North of the misocyclone convergence deepens the moist layer resulting in enhanced probability of air reaching the LCL. 2321 2324 • South of the misocyclone moisture is scoured from the west, locally shifting the dryline eastward. 2327 2330
Misocyclone - conceptual model From Buban et al. (2007) • Friction induced horizontal vorticity at very low levels may also be tilted and stretched. • Horizontal vorticity associated with an HCR crossing the DL is tilted and stretched. • The dryline secondary circulation may also provide a source of vertical vorticity if tilted into the vertical by the updraft.
Summary/Conclusions • For CI to occur, air must rise to the LCL and LFC • Air generally doesn’t get to the LCL/LFC through buoyancy alone, so some other forcing mechanism must be present for CI to occur • Many studies have found near-surface boundaries provided enhanced convergence and vertical motion to allow parcels to reach their LFC. • Misocyclones have become a subject of interest recently for their potential role in CI. • Observations and numerical simulations have shown a tendency for increased convergence and a deepening moist layer north of misocyclones, resulting in a greater likelihood of air reaching the LCL and possibly greater probability for CI.