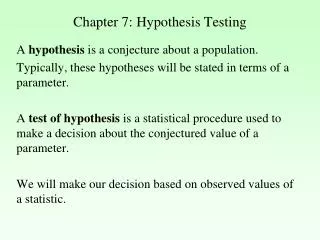
chapter-7 hypothesis testing for quantitative variable
chapter-7 hypothesis testing for quantitative variable. contents. introduction Hypothesis testing 2.1 One sample t test 2.2 two independent-samples t test 2.3 Paired-samples t test. Hypothesis testing.

chapter-7 hypothesis testing for quantitative variable
E N D
Presentation Transcript
chapter-7 hypothesis testing for quantitative variable
contents • introduction • Hypothesis testing 2.1 One sample t test 2.2 two independent-samples t test 2.3 Paired-samples t test
Hypothesis testing Aim: Is the average English score of students from 2 schools different or same? Methods1. Compute and compare two population mean directly
Hypothesis testing Aim: Is the average English score of students from 2 schools different or same? Methods 2 Do a sampling study and then do hypothesis testing
The reason that • True difference between two population means. • Chance (sampling error) So the hypothesis task is to differentiate that the difference between two samples is from the true difference between two population means or from chance.
The purpose of hypothesis testing is to aid the clinician, researcher, or administrator in reaching a conclusion concerning a population by examining a sample from the population. • “Is the effect of the new drug significant than the old drug?”, • “which one is better between the two operations? ” • “Did the large amounts of advertising describe the benefits of new drugs? ”
1 What does statistic test do? [EXAMPLE1]General the average height of 7 years old children increases 4cm in one year. Some researcher let 100 of 7 years old children get a bread appended lysine in everyday. After one year the average height of 100 children increases5cm, and the standard deviation is 2cm. Basing on the data can we think: lysine benefits growth of stature of 7 years old children?
Suppose =0 Compute T.S Find P-value
STEPS 2 Steps of hypothesis testing The statisticians have made a set of steps as fixed as legal procedure, and made some formulas to calculate test statistic (T.S).
Set up hypothesis and confirm α STEPS compute test statistic Find P value P>α P≤α Make conclusion Reject H0, the difference is significant. Don’t reject H0, the difference is not significant
Put forward null hypothesis and alternative hypothesis What is null hypothesis? 1. The test is designed to assess the strength of the evidence against Ho. 2. It is denoted by H0 H0: 0
Put forward null hypothesis and alternative hypothesis What is alternative hypothesis? (1) It is contradictory to null hypothesis (2) It is denoted by H1 H1:< 0, 0 or 0
Confirm significant level What is significant level? • a probability of rejecting a true null hypothesis • denoted by α (alpha) Generally, 0.05. • determined by the investigator in advance.
Determine the appropriate T.S The selection of test statistics is related with many factors, such as the type of variable, research aims and conditions proffered by the sample.
Find P-valueand draw conclusion The mathematician have calculated probability corresponding to every T.S, and listed in some tables. This is the probability that the test statistic would weigh against Ho at least as strongly as it does for these data.
Find P-valueand draw conclusion If P≤α, we reject Ho in favor of H1 at significant level α, We may think that the two populations are different; If P>α, we don`t reject Ho at significant level α. We may think that two populations are same.
TypeⅠerror versus typeⅡ error in hypothesis testing Because the predictions in H0 and H1 are written so that they are mutually exclusive and all inclusive, we have a situation where one is true and the other is automatically false. when H0 is true ,then H1 is false. • If we don’t reject H0,we have done the right thing. • If we reject H0 ,we have made a mistake. Type Ⅰ error: Reject H0 when it is true. The probability of type Ⅰ error is
TypeⅠerror versus typeⅡ error in hypothesis testing when H0 is false ,then H1 is true. • If we don’t reject H0 , we have made a mistake. • If we reject H0 , we have done the right thing. TypeⅡ error : Don’t reject when it is false. The probability of type Ⅱ error is . is more difficult to assess because it depends on several factors. 1- is called the power of the test.
Tradeoff between and You can not reduce two types error at the same time when n is fixed For fixed n, the lower , the higher . And the higher , the lower
Two-sided test and one-sided test 1 Two-sided test:Interest in whetherm m0 2 One-sided test:Interest in whetherm m0 , orm m0
m ≤ m0 m > m0 or Comparison of sample mean and population mean μo m ≥m0 m < m0
m1≤ m2 m1> m2 or Comparison of two sample means m 1 ≥ m2 m1 < m2
Two-sided test Confidence level Reject region Reject region 1 - a/2 a/2 Not reject region H0 T.S Critical value Critical value
one-sided test Confidence level Reject region 1 - a Not reject region H0 Critical value T.S
one-sided test Confidence level Reject region 1 - a Not reject region H0 Critical value T.S
Section Ⅱ t-test 2.1 One sample t test 2.2 Two independent-samples t test 2.3 Paired-samples t test
2.1 One sample t test Model assumptions of one-sample t-test (1) n≥50 (2) n<50 and the sample comes from normal population. Test statistic
EXAMPLE1 Generally the average height of 7 years old children in city A increases 4cm in one year. One researcher let 100 children of 7 years old randomly drawn from the city A get a bread appended lysine in everyday. After 1 year the average height of 100 children increases 5cm, and the standard deviation is 2cm. Basing on the data can we think: lysine benefits growth of stature of 7 years old children?
Solution: • Ho: μ≤μo H1: μ>μo =0.05 • Compute T.S df=100-1=99
Find P-value and draw conclusion ∵t=5>1.660 ∴P < 0.05 Because P is smaller than α, we reject Ho at the significant level 0.05 in favor of H1 . We can think that lysine benefits growth of stature of 7 years old children.
one-sided test Confidence level Reject region 1 - a Not reject region H0 1.660 5
【exercise 1】25 adult female was chosen randomly from Zhengzhou city in 2010 and the systolic blood pressure was measured by standard methods. To test whether the average of SBP in Zhengzhou city is same with the average level( 126.5mmHg) in China?
degree of freedom 2.2 two independent-samples t test assumptions • The data of two samples must come from normal distribution. • Two population variances are equal. Test statistic
2.2 two independent-samples t test • When the assumption of normal distribution is valid while the equality of variance is violated , we should choose correction t test ( test) • When the assumption of normal distribution is violated , we should choose rank sum test.
Example 2 Company officials were concerned about the length of time a particular drug product retained its potency. A random sample, sample 1, of n1=10 bottles of the product was drawn from the production line and analyzed for potency. A second sample, sample 2, of n2=10 bottles was obtained and stored in a regulated environment for a period of one year. Whether the two population mean are different at 0.05 level? Suppose the two samples come from normal population.
Table 5.1 potency for two samples sample 1 sample 2 10.2 10.6 9.8 9.7 10.5 10.7 9.6 9.5 10.3 10.2 10.1 9.6 10.8 10.0 10.2 9.8 9.8 10.6 10.1 9.9 Calculated :
Solution : • Ho: μ1=μ2H1: μ1≠μ2 α= 0.05 • Compute t • t0.05,18=2.101, so P<. We rejectHo in favor of H1 at level 0.05, then we can think their potencies are different.
Two-sided test Confidence level Reject region Reject region 1 - a/2 a/2 Not reject region H0 4.24 -2.101 2.101
H0: Normal H1: Not normal SAMPLE1 normal SAMPLE2 normal
Result of t test Tests of equality of variance Result of correction t test
To test equality of variances? • Ho: 12= 22 , H1: 12≠22 =0.05 • Compute F • Conclusion : find F critical value in table 4. If If 12≠22 12= 22
we have known: S12 =0.105, n1 =10, • S22 =0.058, n2 =10 • Ho: 12= 22 , H1: 12≠22 ,=0.05 • Compute F • Conclusion : find F critical-value in table 4. , so we can think: 12= 22 .