Approaches to Hypothesis Testing: Classical vs. Bayesian Methods
Learn the fundamentals of classical and Bayesian approaches to hypothesis testing, including types of hypotheses, logic, decision errors, and testing methods like parametric and nonparametric tests. Explore ANOVA applications and multiple comparison tests.


Approaches to Hypothesis Testing: Classical vs. Bayesian Methods
E N D
Presentation Transcript
Approaches to Hypothesis Testing • Classical Statistics vs. Bayesian Approach • Classical Statistics • sampling-theory approach • Making inference about a population based on sample evidence • objective view of probability • Allowing how much error is likely to occur • decision making rests on analysis of available sampling data
Approaches to Hypothesis TestingContinued • Bayesian Statistics • extension of classical statistics • In addition, consider additional elements of prior information such as subjective probability estimates to improve the decision maker’s judgment. • Statistically more sophisticated
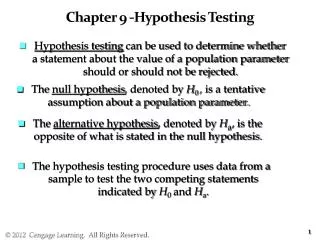
Types of Hypotheses • Null Hypothesis • that no statistically significant difference exists between the population parameter and the sample statistic being compared • Alternative Hypothesis • logical opposite of the null hypothesis • that a statistically significant difference does exist between the population parameter and the sample statistic being compared.
Logic of Hypothesis Testing • Depending on how the alternative hypothesis is defined, two tailed or one tailed test. • Two tailed test • nondirectional test • considers two possibilities (change could be increase or decrease) • One tailed test • directional test • places entire probability of an unlikely outcome to the tail specified by the alternative hypothesis (change is either increase or decrease)
Decision Errors in Testing • Type I error (α) • a true null hypothesis is rejected (or a innocent person is unjustly convicted) • Type II error (β) • one fails to reject a false null hypothesis (or a guilty person is acquitted) • Greater emphasis is given on not committing Type I error.
Testing for Statistical Significance • State the null hypothesis • Choose the statistical test (t, Z, Chi-square, ANOVA, etc.) • Select the desired level of significance (α) • Confidence level =1- α • Compute the calculated value • Obtain the critical value
Testing for Statistical SignificanceContinued • Interpret the test and make decision • Compare the calculated value and critical value and make a decision. • If the calculated actual value > the critical value, reject the null hypothesis. • If the calculated actual value < the critical value, do not reject the null hypothesis. • Or compare p value (probability of the sample value falling into the rejection area) and α. • If p < α, then reject the null hypothesis • If p > α, then do not reject the null hypothesis.
Classes of Significance Tests • Parametric tests (Z or t tests) • Z or t test is used to determine the statistical significance between a sample mean and a population parameter • t test is for smaller sample and/or when population standard deviation is unknown. • Assumptions: • independent observations • normal distributions • populations have equal variances • at least interval data measurement scale
Classes of Significance TestsContinued • Nonparametric tests (χ2 test) • Chi-square test is used for situations in which a test for differences between samples is required • Assumptions • independent observations for some tests • normal distribution not necessary • homogeneity of variance not necessary • appropriate for nominal and ordinal data, may be used for interval or ratio data
Applications • One sample tests • Z or t test (pp. 535-536) • Chi-square test (pp. 536-537) • Two sample tests • Interdependent samples • Z or t test (pp. 539-540) • Chi-square test (pp. 540-542) • Related samples • Z or t test (pp. 543-544) • Chi-square test (McNemar test on pp. 545-546)
ANOVA (Analysis of Variance) • One-way ANOVA (k independent samples test) • the statistical method (F-test) for testing the null hypothesis that means of several populations are equal by a single grouping variable (or factor) • Two-way ANOVA (k related samples test) • The statistical method (F-test) for testing the null hypothesis that means of several populations are equal by two grouping variables (factors)
ANOVA (analysis of Variance)Continued • Multiple comparison test • test the difference between each pair of means and indicate significantly different group means at a specified alpha level • use group means and incorporate the mean square error term of the F ratio
K Related Samples Test Use when: • The grouping factor has more than two levels • Observations or participants are • matched . . . or • the same participant is measured more than once • Interval or ratio data