Chapter 9 Hypothesis Testing
Chapter 9 Hypothesis Testing. 9.1 The Language of Hypothesis Testing. Steps in Hypothesis Testing 1. A claim is made. Steps in Hypothesis Testing 1. A claim is made. 2. Evidence (sample data) is collected in order to test the claim. Steps in Hypothesis Testing 1. A claim is made.


Chapter 9 Hypothesis Testing
E N D
Presentation Transcript
Chapter 9Hypothesis Testing 9.1 The Language of Hypothesis Testing
Steps in Hypothesis Testing 1. A claim is made.
Steps in Hypothesis Testing 1. A claim is made. 2. Evidence (sample data) is collected in order to test the claim.
Steps in Hypothesis Testing 1. A claim is made. 2. Evidence (sample data) is collected in order to test the claim. 3. The data is analyzed in order to support or refute the claim.
A hypothesis is a statement or claim regarding a characteristic of one or more populations. In this chapter, we look at hypotheses regarding a single population.
Examples of Claims Regarding a Characteristic of a Single Population • In 1997, 43% of Americans 18 years or older participated in some form of charity work. A researcher believes that this percentage different today.
Examples of Claims Regarding a Characteristic of a Single Population • In 1997, 43% of Americans 18 years or older participated in some form of charity work. A researcher believes that this percentage different today. • In June, 2001 the mean length of a phone call on a cellular telephone was 2.62 minutes. A researcher believes that the mean length of a call has increased since then.
Examples of Claims Regarding a Characteristic of a Single Population • In 1997, 43% of Americans 18 years or older participated in some form of charity work. A researcher believes that this percentage different today. • In June, 2001 the mean length of a phone call on a cellular telephone was 2.62 minutes. A researcher believes that the mean length of a call has increased since then. • Using an old manufacturing process, the standard deviation of the amount of wine put in a bottle was 0.23 ounces. With new equipment, the quality control manager believes the standard deviation has decreased.
CAUTION! We test these types of claims using sample data because it is usually impossible or impractical to gain access to the entire population. If population data is available, then inferential statistics is not necessary.
Consider the researcher who believes that the mean length of a cell phone call has increased from its June, 2001 mean of 2.62 minutes. To test this claim, the researcher might obtain a simple random sample of 36 cell phone calls. Suppose he determines the mean length of the phone call is 2.70 minutes. Is this enough evidence to conclude the length of a phone call has increased? We will assume the length of the phone call is still 2.62 minutes. Assume the standard deviation length of a phone call is known to be 0.78 minutes.
What if our sample resulted in a sample mean of 2.95 minutes?
Hypothesis testing is a procedure, based on sample evidence and probability, used to test claims regarding a characteristic of one or more populations.
The null hypothesis, denoted Ho (read “H-naught”), is a statement to be tested. The null hypothesis is assumed true until evidence indicates otherwise. In this chapter, it will be a statement regarding the value of a population parameter. The alternative hypothesis, denoted, H1 (read “H-one”), is a claim to be tested. We are trying to find evidence for the alternative hypothesis. In this chapter, it will be a claim regarding the value of a population parameter.
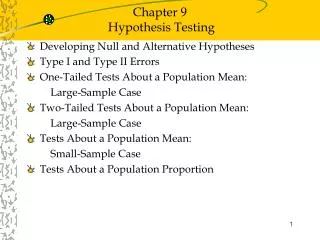
In this chapter, there are three ways to set up the null and alternative hypothesis. 1. Equal versus not equal hypothesis (two-tailed test) Ho: parameter = some value H1: parameter some value
In this chapter, there are three ways to set up the null and alternative hypothesis. 1. Equal versus not equal hypothesis (two-tailed test) Ho: parameter = some value H1: parameter some value 2. Equal versus less than (left-tailed test) Ho: parameter = some value H1: parameter < some value
In this chapter, there are three ways to set up the null and alternative hypothesis. 1. Equal versus not equal hypothesis (two-tailed test) Ho: parameter = some value H1: parameter some value 2. Equal versus less than (left-tailed test) Ho: parameter = some value H1: parameter < some value 3. Equal versus greater than (right-tailed test) Ho: parameter = some value H1: parameter > some value
EXAMPLE Forming Hypotheses For each of the following claims, determine the null and alternative hypothesis. • In 1997, 43% of Americans 18 years or older participated in some form of charity work. A researcher believes that this percentage different today. • In June, 2001 the mean length of a phone call on a cellular telephone was 2.62 minutes. A researcher believes that the mean length of a call has increased since then. • Using an old manufacturing process, the standard deviation of the amount of wine put in a bottle was 0.23 ounces. With new equipment, the quality control manager believes the standard deviation has decreased.
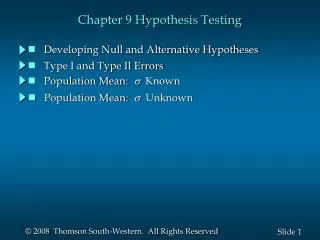
Four Outcomes from Hypothesis Testing 1. We could reject Ho when in fact H1 is true. This would be a correct decision.
Four Outcomes from Hypothesis Testing 1. We could reject Ho when in fact H1 is true. This would be a correct decision. 2. We could not reject Ho when in fact Ho is true. This would be a correct decision.
Four Outcomes from Hypothesis Testing 1. We could reject Ho when in fact H1 is true. This would be a correct decision. 2. We could not reject Ho when in fact Ho is true. This would be a correct decision. 3. We could reject Ho when in fact Ho is true. This would be an incorrect decision. This type of error is called a Type I error.
Four Outcomes from Hypothesis Testing 1. We could reject Ho when in fact H1 is true. This would be a correct decision. 2. We could not reject Ho when in fact Ho is true. This would be a correct decision. 3. We could reject Ho when in fact Ho is true. This would be an incorrect decision. This type of error is called a Type I error. 4. We could not reject Ho when in fact H1 is true. This would be an incorrect decision. This type of error is called a Type II error.
EXAMPLE Type I and Type II Errors • For each of the following claims explain what it would mean to make a Type I error. What would it mean to make a Type II error? • In 1997, 43% of Americans 18 years or older participated in some form of charity work. A researcher believes that this percentage different today. • In June, 2001 the mean length of a phone call on a cellular telephone was 2.62 minutes. A researcher believes that the mean length of a call has increased since then.
EXAMPLE Wording the Conclusion In June, 2001 the mean length of a phone call on a cellular telephone was 2.62 minutes. A researcher believes that the mean length of a call has increased since then. (a) Suppose the sample evidence indicates that the null hypothesis should be rejected. State the wording of the conclusion. (b) Suppose the sample evidence indicates that the null hypothesis should not be rejected. State the wording of the conclusion.