Download
1 / 25
250 likes | 487 Views
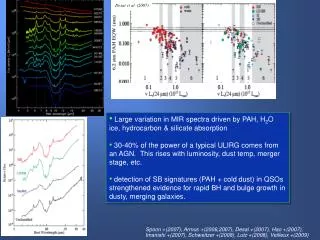
Desai et al. (2007). Large variation in MIR spectra driven by PAH, H 2 O ice, hydrocarbon & silicate absorption 30-40% of the power of a typical ULIRG comes from an AGN. This rises with luminosity, dust temp, merger stage, etc.

E N D
Desai et al. (2007) • Large variation in MIR spectra driven by PAH, H2O ice, hydrocarbon & silicate absorption • 30-40% of the power of a typical ULIRG comes from an AGN. This rises with luminosity, dust temp, merger stage, etc. • detection of SB signatures (PAH + cold dust) in QSOs strengthened evidence for rapid BH and bulge growth in dusty, merging galaxies. Spoon +(2007), Armus +(2006,2007), Desai +(2007), Hao +(2007), Imanishi +(2007), Schweitzer +(2008), Lutz +(2008), Veilleux +(2009)
ISM properties • Pure rotational H2 lines detected in about 80% of sample. - average warm (300K) molecular gas mass is 2x10⁸M - warm/cold gas mass is typically less than 1% (large range) (only 3 sources detected in S(0) 28.2m; f < few x 10-20 W cm-2) - warm fraction not correlated with MIR slope - 10-5 < LH2/LIR < 10-3 (mean is about 10-4) Higdon et al. (2006) • Crystalline silicates (forsterite=Mg2SiO4) found in 12 ULIRGs. - Crystallinity (mass column density ratio) is 0.07-0.15 (avg = 0.11), about 10x higher than in MW ISM. - CR amorphization (injection) is occurring much slower (faster) Spoon et al. (2006) • Dense (n > 3x106 cm-3), warm (200-700K) gas is seen in absorption in some deeply obscured ULIRGs (AGN and SB types). - column densities are 1015-1017 cm-2 in C2H2, HCN and CO2 - relatively low T, high abundances (wrtYSOs) may imply deeply embedded, confined star formation. Lahuis et al. (2007)
Menendez-Delmestre et al.(2009) • Majority of bright 1 < z < 3 sources are AGN dominated, but by pushing fainter, selecting on IR color, or FIR excess, extremely powerful SB are found in galaxies and QSOs. • SMGs look a lot more like low-luminosity SB galaxies than low-zULIRGs. Strong PAH, low tau – consistent with large sizes estimated from radio, CO maps (e.g. Chapman et al. 2004; Tacconi et al. 2008; Biggs & Ivison 2008). • High-luminosity, high-z SB are not mostly late-stage mergers (like they are at low-z). Pope et al. (2008) Farrah et al. (2008) Houck +(2005), Yan +(2005,2007), Sajina +(2007), Pope +(2008), Farrah +(2008), Lutz +(2008), Menendez-Delmestre +(2009), etc. Lutz et al. (2008)
Menendez-Delmestre et al. (2009) • z=2 SMG’s have similar PAH/LIR as local starbursts • SMG’s have lower silicate optical depths than local ULIRGs.
At z=1, IR-luminous galaxies represent ≥ 50% of the co-moving IR energy density. Magnelli et al. (2009)
Why study LIRGs? • All interaction stages are represented. • Disentangle nuclear and disk properties. Compare to merger models. Resolve MIR, UV, gas emission. • Detailed study of a population that has undergone rapid evolution since z=1.
Reaching LIRGs at z > 1 using strong lensing • 15 strongly lensed MIPS-24 sources • 3x < M < 25x. Observed median f24 =0.8 mJy • 9/15 are SB dominated with strong PAHs • faint pop. may still have sign. AGN fractions Rigby et al. (2008)
5MUSES: Spitzer IRS survey of 330 galaxies with 5 < f24 < 100 mJy in SWIRE, FLS. GOALS: Spitzer, HST, Chandra, and GALEX survey of 202 LIRGs in the IRAS RBGS. Will include VLA, CARMA, NIR spectroscopy, UBVRK imaging, etc.
GOALS A comprehensive study of 202 LIRGs in the local Universe drawn from the IRAS RBGS (629 with |b| > 5o, S60 > 5.24 Jy)http://goals.ipac.caltech.edu • Spitzer:IRAC, MIPS, images of complete sample. IRS spectra of all nuclei. IRS maps of representative subset. • HST:ACS B, I and NICMOS H-band images of those with log LIR > 11.4 L and ACS FUV (F140 LP) imaging of 25. • GALEX:FUV & NUV images of about 70% of the sample. • Chandra:X-ray images of about 1/2 of HST sample. • …also includes observations with CARMA & Nobeyama (CO), Palomar (NIR), Keck OSIRIS (NIR), GEMINI TreCS, etc. Team:J. Mazzarella, D. Sanders, J. Surace, A. Evans, K. Iwasawa, J. Howell, B. Chan, T. Vavilkin, A. Petric, H. Inami, V. U, S. Haan, S. Stierwalt, P. Appleton, S. Lord, S. Veilleux, L. Kewley, H. Spoon, V. Charmandaris, J. Marshall, B. Madore, B. Schulz, K. Xu, D. Frayer, S. Satyapal, J. Jensen, S. Komossa, D.C. Kim, G. Bothun
About 50-60% of LIRGs are involved in a major merger (distorted isophotes, tails, bridges, double nuclei…). • ≈ 30% are in early stages (near 1st pass) • ≈ 25% are in late stages (double nuclei, overlapping disks, etc.) • For the interacting set, about 1/2 have two nuclei with Δr < 20 kpc (avgΔr = 5 kpc). About 1/2 of all secondary nuclei are not visible in B-band. • Excluding ULIRGs, about 65% of the total LIR from the sample comes from mergers.
Petricet al. (2010) • Spectral shape and AGN power • A large range in spectral shapes among LIRGs. • While [NeV] is seen in 21% of LIRGs, the vast majority (90%) are SB dominated. The AGN fraction rises toward the latest merger stages. • The integrated AGN contribution to the IR in LIRGs alone is 10-15% - about 1/4 - 1/3 that of ULIRGs. Stierwalt et al. (in prep)
Size vs. wavelength • 2D IRS spectra of most LIRGs fall into 3 families: constant extent vs. wavelength, PAH/line more extended than continuum, and maximum extent at 10μm. • More than 30% have FEE > 0.5. LIRGs are 2-3x more extended than ULIRGs. Mean FWHM at 13μm are 2.6 kpc for LIRGs. • LIRGs that are warmer, more AGN-like, and late stage mergers are more compact in the MIR. • Low nuclear [NeIII]/[NeII] suggests high densities and/or older average popn. (buried young stars). Diaz-Santos +(2010) Periera-Santaella +(2010)
UV Properties 108 yr SB Salpeter IMF • Median ΔIRX = 2.7, but ranges from 0.2 – 68. • (hugeover-estimates possible at high β) • No simple correlations with FIR color, 8/24, 8μm compactness, merger stage, etc. • Median SFR (FUV)/SFR (tot) = 4% • 32% of resolved pairs have different components dominating (above 2:1) FIR and FUV (see Charmandaris et al. 2004). 21% have a single galaxy that dominates both the FIR and FUV. Meurer + (99) SB fit • 135 systems (33 resolved): • median IR/fuv = 95 • (range: 12 – 2630) • median log Lfuv = 9.4 L • (range 7.1 - 10.3) Howell et al. (2010) Gil de Paz +(2007); Cortese +(2006); Kong +(2004), Buat +(2009;2010) • β= [log (fNUV / fFUV)]/0.182
VV 340N Emits more than 90% of LIR • IRS spectra, hard X-rays indicate a buried AGN in VV 340N contributing 10-15% of LIR VV 340 LIR= 5.5x10¹¹L z= 0.034
II Zw 096 F140 LP F435W • z = 0.036 • LIR = 8x10¹¹ L Inamiet al. (2010) contours: MIPS-24 NICMOS H F814W • At least 80% of FIR emission comes from source D, with a SFR = 120 Myr-1. More than 10x Antennae overlap (Mirabel et al. 1998; Brandl et al. 2009) • Luminosity density = 4-5x10¹⁰ L kpc-2 if NICMOS size (220 pc radius) is used. See also Goldader et al. (1997) RGB = NICMOS H, ACS F435W, SBC F140LP
Elbaz et al. (2010) • Measuring true LIR with Herschel • For z >1.5, MIR overestimates LIR by 2-3x, or more (Elbaz et al. 2010). See also Dannerbauer et al. (2010). • >> MIR decomposition of IRS data suggests PAH (not hot dust) dominates (Murphy et al. 2009). • ULIRGs are 10-20% colder at z > 1 than local LIR trends suggest (Hwang et al. 2010). • >> high-zULIRGs are colder, more SB dominated, less luminous than you would expect by fitting local templates. Scaling by LIR alone is insufficient. The process (mergers) and the conditions (gas fraction) matter. Hwang et al. (2010)
FIR spectra of high-z galaxies • Measure primary FIR coolants ([CII] 158), [OI] 63, [OIII] 52, 88) to z > 1. • >> at z=1-2, need to reach levels of ≈10-19 Wm-2 • Extend MIR AGN/SB diagnostics beyond z >3-4 • >> [NeII], [OIV], [NeV] at z=2: ≈10-20 Wm-2 • Trace feedback between supernovae, AGN and cold gas (fuel for star-formation) by combining warm H2, X-ray, atomic gas dynamics, etc.
FIR cooling lines as SB probes • [CII] 158 is one of the brightest emission lines (0.1-1% LIR), a primary PDR coolant & sensitive probe of the ISRF. • roughly constant [CII]/PAH >> gas heating is dominated by small grains (photo-electric effect) • decrease in [CII]/FIR for warmer dust temps and high-luminosity, stronger radn fields (or high density) >> decoupling of dust and gas. >> [CII] not a reliable SFR indicator at high LIR ?!! Helouet al. (2001) Brauher et al. (2008); Helou et al. (2001) Malhotra et al. (2001); Tielens & Hollenbach (1985) Wolfire et al. (1990); Kaufman et al. (1999) Brauher et al. (2008)
MIPSJ142824.0+32 (z=1.325, LIR = 3E13 L) has strong PAH (Desai et al. 2006), [OI] 63, [OIII] 52 (Sturm et al. 2010) and [CII] 158 emission (Hailey-Dunsheath et al. 2010). • FIR lines are significantly larger than seen in local ULIRGs, comparable to low-luminosity SB galaxies, but from a large SB (3-10 kpc). • Suggests [CII] can be used as a SF tracer even in some extreme (SFR > 300 M/yr) environments • (see also z=4-6 QSOs detected in [CII] – in particular BRI0952-0115 at z=4.43 by Maiolino 2009 and [OIII] 88 in SMM J02399 by Ferkinoff 2010). Hailey-Dunsheath et al. (2010) Sturm et al. (2010)
3.1m, cold (4.5K) primary • radiative cooling + closed cycle coolers • Earth-Sun L2 orbit • possible launch in 2017 Possible instruments • Japan/Korea • - MIR imager/spectrometer (4-40m) • - MIR coronograph (5-27m) • European Consortium (SAFARI) • - Imaging FTS (30-210m; R=10-3000) • US (BLISS) • - Broad-band grating spec. w/ low-noise bolometers (40-400 m; R=1000) SPICA
SPICA sits squarely between JWST and ALMA in wavelength and discovery space. • When do the first black holes form ? • > How does the MBH-sigma relation • evolve with redshift ? • How does feedback regulate SF ? • What is the chemical history of the Universe ?
Riecherset al. (2008) • 6.2 PAH in z=4.1 QSO PSS J2322+1944 • CO lensed into ring (5 kpc, 1010 M)
FIR cooling lines Basics • The [CII] 157.71 m line is the most important coolant of the warm, neutral ISM. (excitation energy, E/k = 91 k) • Photoelectrons ejected from dust grains dominate the heating of the neutral gas. The efficiency (gas heating rate by e-1 / grain heating by UV photons) is typically 0.1-1%. • The [OI] 63.2 m line (E/k = 228 k, ncrit = 5x105 cm-3) and the [OIII] 88 line become more important than [CII], at higher temperatures, densities, and LIR. > The [OI]/[CII] ratio rises with 60/100 (it’s 2 for 60/100 > 1), while the [OI]/FIR ratio 0.002 shows no obvious drop at high LFIR or 60/100. Tielens & Hollenbach (1985); Wolfire, Tielens & Hollenbach (1990); Hollenbach & Teilens (1999); Kaufman, et al. (1999)
High-z cooling • The [OI] 63m line is accessible to CALISTO (assuming 30-500m coverage) for 0 < z < 7. The [CII] 158m line is accessible for 0 < z < 2. • Both the [OI] and [CII] lines would be easily detected in ULIRGs and even LIRGs at z=2, with S/N = 5-10 in less than 10 mins with CALISTO. • At z=5, a LIRG could be detected in [OI] with S/N = 5-10 in 1 hr. >>The high sensitivity and wavelength coverage, allows us to trace the cooling in LIRGs and ULIRGs throughout the epochs where they evolve and begin to dominate the FIR background. A ULIRG at z=1 would require many hours with PACS. Only the most luminous systems are accessible to PACS at z ≥ 1. • An L* galaxy could be detected in both lines at z=2 with S/N > 10 in 1hr. The [OI] line could be detected at z=5 in a few hrs. (All estimates based on a 5, 1hr sensitivity of 10-21 W m-2))
Walter et al. (2009) Maiolinoet al. (2009) • metals and (indirect) evidence for small grains at high-z • spatially resolved [CII] 158 in z=6.42 QSO SDSS J114816.6+52 Radius ≈750 pc. Implied SFR ≈ 1700 M yr-1, SF lum. Dens. ≈ 1013 L kpc-2. [CII]/LIR and size comparable to low-zULIRGs. • Large [CII]/LIR in BR0952 (z=4.43; Maiolino et al. 2009) is much closer to levels found in SB galaxies. BR1202 (z=4.7; Iono et al. 2006) is in-between. See also BRI1335 (z=4.4; Wagg, Carilli et al. 2010)


![Koepke et al., [1997] Kaufman and Tanre [1997] Levy et al., [2004] Remer et al., [2006]](https://cdn2.slideserve.com/3945504/slide1-dt.jpg)