Download
1 / 7
70 likes | 106 Views
Explore how policies influence land use transitions and forest changes. Analytical framework testing hypotheses, drivers of stages, and equity issues. Value in informing policies and providing scenarios.

E N D
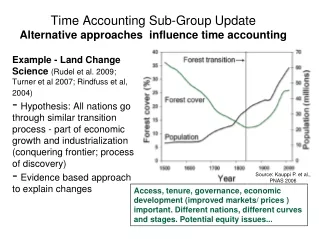
Time Accounting Sub-Group UpdateAlternative approaches influence time accounting Example - Land Change Science (Rudel et al. 2009; Turner et al 2007; Rindfuss et al, 2004) • Hypothesis: All nations go through similar transition process - part of economic growth and industrialization (conquering frontier; process of discovery) • Evidence based approach to explain changes Source: Kauppi P. et al., PNAS 2006 Access, tenure, governance, economic development (improved markets/ prices ) important. Different nations, different curves and stages. Potential equity issues...
“Land and Forest Transitions” Forest Transitions- Well-documented empirically (Mather 1992, Lambin & Meyfroidt, 2009)- Sub-national, national, regional… - Analytical framework for testing hypotheses - Forest biomass, “forest identity (Kauppi et al) Special Issue of the Land Use Policy Journal [vol.27, 2010] dedicated to land use transitions - Analysis of interactions among causal factors - Systems approach, “land use allocation” that can link to other policy and economic analysis (Barbier et al 2009) Value: inform policy, provide improved baseline scenarios and guide land supply assumptions…
Different stages- associated with different drivers and circumstances How does a policy influence: - downward slopes? - low point? - recovery how soon it starts, persistence, slope)? Source: Grainger 1998
What are key drivers of each stage? Source: Grainger 1998 1. Declining slope: open access (physical access, facilitated access), low wages, extractive enterprises (biophysical factors)… 2. Decline prolonged by “market failures,” policies (under value forests). Low point : either access blocked (physical, institutional, cultural or effective legal protection or policies corrected (endogenous factors) 3. Recovery: Socio-economic factors (incl. exogenous factors), policy incentives, improved , governance
Three stages of transition withdifferent drivers-circumstances Cleared land - FIRE is a management tool for large areas of underdeveloped land. 330-430 Mha burn each year (Giglio et al 2010) - “Developed” area can offset forest gains as agriculture land is released Managed agriculture Source: adapted from Barbier et al. 2009
LUC emission trajectories interact with baseline - Determined by model, inputs, assumptions- Prior emission fluxes? Choice of points in time makes a difference- How does the policy interact with the baseline trends “Farmland” lost at avg. Rate of 3.4 M acres per year (1999-07). Sources: USDA NASS 2010: “Farms, Land in Farms, and Livestock Operations 2009 Summary: Feb 12, 2010. RFA for US ethanol production statistics. Separate note: NRI 2007 found that “developed” land class grew (27 M acres 1992-07) while “cropland” fell by 24 M acres same period.
References • Mather, A.S. 1992: The forest transition. Area 30, 117-124. • Lambin, E.F. and Meyfroidt, P. 2010: Land use transitions: ecological feedback versus exogenous socio-economic dynamics. Land Use Policy 27, 108-118. • Grainger, A. 1998: Modelling tropical land use change and deforestation. In Goldsmith B. ed. Tropical Rain Forests, a Wider Perspective. Chapman and Hall, London, 302-344. • Grainger A., 2010: The bigger picture - tropical forest change in context, concept and practice. In Nagendra H. and Southworth J. eds.. Reforesting Landscapes, Linking Pattern and Process. Springer, Berlin, 15-43 • Grainger A. 2008: Difficulties in tracking the long-term global trend in tropical forest area. Proceedings of the National Academy of Sciences USA 105, 818-823. • Grainger, A. 1984. Quantifying changes in forest cover in the humid tropics, overcoming current limitations. Journal of World Forest Resource Management 1, 3-62. • Mather, A.S. 2007: Recent Asian forest transitions in relation to forest-transition theory. International Forestry Review 9, 491 -501. • Lambin, E.F., Geist, H.J. and Lepers, E. 2003: Dynamics of land use and cover change in tropical regions. Annual Review of Environment and Resources 28, 205-241. • Geist, H.J. and Lambin, E.F. 2002: Proximate causes and underlying driving forces of tropical deforestation. BioScience 52, 143–150. • Lambin, E.F., Geist, H.J. and Lepers, E. 2003: Dynamics of land use and cover change in tropical regions. Annual Review of Environment and Resources 28, 205-241. • Mather, A.S. and Needle C.L. 1999. Development, democracy and forest trends. Global Environmental Change 9, 105-118. • Kauppi, P.E. et al., Proc. Nat. Acad. Sci. U.S.A. 103, 17574 (2006). “Returning forests analyzed with the forest identity.” [This paper describes biomass and forest expansion in many nations, with Brazil and Indonesia being big exceptions. Forest “transition” is strongly correlated with per capita GDP.] • Contreras-Hermosilla A, (2007). “The underlying causes of forest decline.” (CIFOR Occasional Paper 30, Center for International Forestry Research, Bogor, Indonesia, 2000). http://www.cifor.cgiar.org/publications/pdf_files/OccPapers/OP-030.p • USDA 2010: “Farms, Land in Farms, and Livestock Operations 2009 Summary: Released February 12, 2010, by the National Agricultural Statistics Service (NASS), Agricultural Statistics Board, U.S. Department of Agriculture.”