Download
1 / 43
430 likes | 615 Views
International Donor Statistics 1997 % of Multiple Organ Donors. Donors PMP. % Mult . Donors. 71% N/A 81% 82% 70% 65% 80% N/A 80% 76%. Eurotransplant: Germany, Austria, Belgium, Luxembourg, The Netherlands

E N D
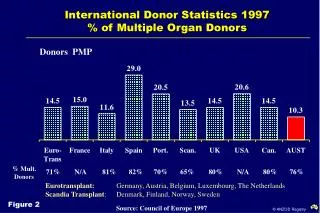
International Donor Statistics 1997% of Multiple Organ Donors Donors PMP % Mult.Donors 71% N/A 81% 82% 70% 65% 80% N/A 80% 76% Eurotransplant: Germany, Austria, Belgium, Luxembourg, The Netherlands Scandia Transplant: Denmark, Finland, Norway, Sweden Figure 2 Source: Council of Europe 1997
Donors Per Month in Australia 1994 - 1997 Number of Donors Figure 6
Age and Gender Distribution of DonorsAustralia 1995 -1997 Males Figure 11
Age and Gender Distribution of DonorsAustralia 1995 -1997 Females Figure 12
Age Group (%) Cadaver DonorsNew Zealand 1995 - 1997 Figure 13
Age and Gender Distribution of DonorsNew Zealand 1995 -1997 Males Figure 14
Age and Gender Distribution of DonorsNew Zealand 1995 -1997 Females Figure 15
Cause of Death - All Donors Australia 1989 - 1997 n=1831 Figure 16
Cause of Death - All Donors New Zealand 1993 - 1997 n=182 Figure 17
Blood Group of Donors Australia 1989 - 1997 n=1831 Figure 29
Blood Group of Donors New Zealand 1993 - 1997 n=182 Figure 30
Waiting List vs Cadaver TransplantsAustralia 1993 - 1997 Waiting List * Kidneys Tx Performed Figure 50
Waiting List vs Cadaver TransplantsNew Zealand 1993 - 1997 Waiting List * Kidneys Tx Performed N/A N/A NB Kidneys sent to Australia: 1994 (4) 1996 (1) 1997 (2) Figure 51
Age of Kidney Donors Australia 1997 Donors for Period (182) Kidney Transplants (355) Figure 53
Age of Kidney Donors New Zealand 1997 Donors for Period (42) Kidney Transplants (83) * * 2 Transplanted in Australia Figure 54
Outcome of Request for Kidney Donation 1997 Australia New Zealand Total Donors 190 No request for donation 3 Request for donation 187 No consent given 0 Consent given 187 Donors Kidneys not retrieved 8 Kidneys retrieved 366 Kidneys not transplanted 9 Kidneys en bloc 2 Kidneys Transplanted 355 Total Donors 42 No request for donation 0 Request for donation 42 No consent given 0 Consent given 42 Donors Kidneys not retrieved 0 Kidneys retrieved 84 Kidney not transplanted 1 Kidneys Transplanted 83 * Figure 57 Figure 58 * 2 Transplanted in Australia
Waiting List vs Cadaver TransplantsAustralia 1993 - 1997 Waiting List * Liver Tx Performed Figure 67
Age of Liver Donors Australia 1997 Donors for Period (125) Liver Recipients (130) (1) * (3) * (1) * Figure 70 * Number of livers transplanted into two recipients
Age of Liver Donors New Zealand 1997 Donors for Period (22) Liver Transplants (22) Figure 71
Outcome of Request for Liver Donation 1997 Australia New Zealand Total Donors 190 No request for donation 25 Request for donation 165 No consent given 3 Consent given 162 Donors Livers not retrieved 32 Livers retrieved 130 Livers not transplanted 5 Livers Transplanted 125 * * 130 recipients transplanted Total Donors 42 No request for donation 7 Request for donation 35 No consent given 1 Consent given 34 Donors Livers not retrieved 12 Livers retrieved 22 Livers not transplanted 0 Livers Transplanted 22 Figure 72 Figure 73
Primary Liver Graft Survival 1986 - 1997According to Donor Age Log Rank 11-40 vs 51-60 p = 0.003 11-40 vs >60 p = 0.043 Figure 75
Primary Liver Graft Survival 1986 - 1997According to Gender Log Rank p = ns Figure 76
Primary Liver Graft Survival 1986 - 1997According to Recipient-Donor Combinations Log Rank p = ns Figure 77
Primary Liver Graft Survival 1986 - 1997According to Donor Cause of Death Log Rank CVD vs Trauma p = ns Trauma vs Tumour p = ns Figure 78
Primary Liver Graft Survival 1986 - 1997According to Gender and Cause of Death Log Rank p = ns Figure 79
Primary Liver Graft Survival 1986 - 1997 According to Inotrope Use Log Rank p = ns Figure 80
Primary Liver Graft Survival 1986 - 1997According to Graft Ischaemia Time Hours Log Rank p = ns Figure 81
Waiting List vs Cadaver Transplants Australia 1993 - 1997 Waiting List * Heart Tx Performed Figure 82
Waiting List vs Cadaver Transplants Australia 1993 - 1997 Waiting List * Heart/Lungs - Lungs Tx Performed Figure 83
Waiting List vs Cadaver Transplants New Zealand 1993 - 1997 Waiting List * Heart Tx Performed Figure 84
Waiting List vs Cadaver Transplants New Zealand 1993 - 1997 Waiting List * Heart/Lungs - Lungs Tx Performed Figure 85
Age of Heart Donors Australia 1997 Donors for Period (93) Heart Transplants (93) * * Includes three hearts used with lung bloc Figure 84
Age of Heart Donors New Zealand 1997 Donors for Period (16) Heart Transplants (16) * * Includes one heart used with lung bloc Figure 89
Outcome of Request for Heart Donation 1997 Australia New Zealand Total Donors 190 No request for donation 39 Request for donation 151 No consent given 8 Consent given 143 Donors Hearts not retrieved 45 Hearts retrieved 98 Hearts not transplanted 5 Hearts Transplanted 93 Total Donors 42 No request for donation 8 Request for donation 34 No consent given 1 Consent given 33 Donors Hearts not retrieved 17 Hearts retrieved 16 Hearts not transplanted 0 Hearts Transplanted 16 Figure 90 Figure 91
Age of Lung Donors Australia 1997 Donors for Period (69) Lung Transplants (132) Number of Recipients Double (47) - Single (38) Includes three double lungs transplanted with heart bloc Figure 94
Age of Lung Donors New Zealand 1997 Donors for Period (5) Lung Transplants (7) Number of Recipients Double (2) - Single (3) Includes one double lungs transplanted with heart bloc Figure 95
Outcome of Request for Lung Donation 1997 Australia New Zealand Total Donors 190 No request for donation 44 Request for donation 146 No consent given 4 Consent given 142 Donors Lungs not retrieved 151 Lungs retrieved 133 Lung not transplanted 1 Lungs Transplanted 132 (Double lung 47 recipients) (Single lung 38 recipients) Total Donors 42 No request for donation 11 Request for donation 31 No consent given 1 Consent given 30 Donors Lungs not retrieved 25 Lungs retrieved 10 Lungs not transplanted 3 Lungs Transplanted 7 (Double lung 2 recipients) (Single lung 3 recipients) Figure 96 Figure 97
Waiting List vs Cadaver TransplantsAustralia 1993 - 1997 Waiting List * Pancreas Tx Performed Figure 99
Age of Pancreas Donors Australia 1997 Donors for Period (16) Pancreas Transplants (16) Figure 100
Outcome of Request for Pancreas Donation 1997 Australia New Zealand Total Donors 190 No request for donation 91 Request for donation 99 No consent given 10 Consent given 89 Donors Pancreas not retrieved 63 Pancreas retrieved 26 Pancreas not transplanted 10 Pancreas Transplanted 16 Total Donors 42 No request for donation 36 Request for donation 6 No consent given 2 Consent given 4 Donors Pancreas not retrieved 3 Pancreas retrieved 1 Pancreas not transplanted 1 Pancreas Transplanted 0 Figure 102 Figure 103
Outcome of Request for Corneal Donation 1997 Australia New Zealand Total Donors 190 No request for donation 37 Request for donation 153 No consent given 46 Consent given 107 Donors Corneas not retrieved 18 Corneas retrieved 196 Corneas not transplanted 20 Corneas Transplanted 128 Corneas Stored 48 Total Donors 42 No request for donation 21 Request for donation 21 No consent given 3 Consent given 18 Donors Corneas not retrieved 5 Corneas retrieved 31 Corneas not transplanted 0 Corneas Transplanted 2 Corneas Stored 29 Figure 104 Figure 105
Outcome of Request for Bone Donation 1997 Australia New Zealand Total Donors 190 No request for donation 146 Request for donation 44 No consent given 19 Consent given 25 Donors Bone not retrieved 9 Bone retrieved 16 Bone not transplanted 0 Bone Stored 16 Total Donors 42 No request for donation 28 Request for donation 14 No consent given 3 Consent given 11 Donors Bone not retrieved 5 Bone retrieved 6 Bone not transplanted 0 Bone Stored 6 Figure 106 Figure 107