Download
1 / 78
780 likes | 804 Views
First passage times on a single molecule level and leapovers of L é vy motions Tal Koren (TAU) Iddo Eliazar (TAU) Aleksei Chechkin (Kharkov) Ophir Flomenbom (MIT) Michael Urbakh (TAU) Olga Dudko (NIH).

E N D
First passage times on a single molecule level andleapovers of Lévy motionsTal Koren (TAU) Iddo Eliazar (TAU)Aleksei Chechkin (Kharkov)Ophir Flomenbom (MIT)Michael Urbakh (TAU)Olga Dudko (NIH)
Single molecule techniques offer a possibility to follow real-time dynamics of individual molecules. • For some biological systems it is possible to probe the dynamics of conformational changes and follow reactivities. • Distributions rather than ensemble averages (adhesion forces, translocation times, reactivities)
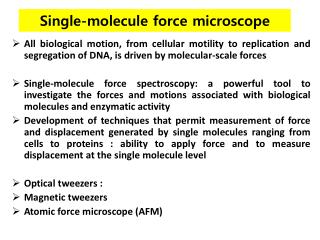
Processes on the level of a single molecule • Dynamic Force Spectroscopy (DFS) of Adhesion Bonds • Enzymatic activity(in collaboration with the groups of de Schryver and Nolte) • Translocation of a ssDNA through a nanopore • Search of a circular DNA • Protein vibrations
Dynamic Force Spectroscopy: Force(pN) Distance (nm) Force (pN) Distance (nm)
Single Stranded DNA translocation through a Nanopore: One polymer at a time
Relevantsystems Individualmembranechannels: ionflux & biopolymerstranslocation A. Meller, L. Nivon, and D. Branton. Phys. Rev. Lett.86 (2001) J. J. Kasianowicz, E. Brandin, D. Branton and D. W. Deamer Proc. Natl. Acad. Sci. USA93 (1996) Translocationandconformationalfluctuation J. Li and H. A. Lester. Mol. Pharmacol. 55 (1999). O. Flomenbom and J. Klafter Biophys. J.86 (2004).
Lipase B From Candida Antarctica (CALB) Activity(The groups of de Schryver and Nolte) The enzyme (CALB) is immobilized. The substrate diffuses in the solution During the experiment, a laser beamis focused on the enzyme, and the fluorescent state of a single enzyme is monitored. The Michaelis-Menten reaction
Relevantsystems Chemicalactivity K. Velonia, et al., Angew. Chem. (2005) O. Flomenbom, et al., PNAS (2005) L. Edman, & R. Rigler, Proc. Natl. Acad. Sci. U.S.A.,97 (2000) H. Lu, L. Xun, X. S. Xie, Science, 282 (1998)
Single molecule experiments in proteins:Fractons in proteins Fluorescence resonant energy transfer (tens of angstroms). Photo-induced electron transfer (a few angstroms). S. C. Kou and X. S. Xie, PRL (2004) W. Min et al., PRL (2005) R. Granek and J. Klafter, PRL (2005)
Autocorrelation function Small scale motion – VIBRATIONS?
Dynamic Force Spectroscopy: Force(pN) Distance (nm) Force (pN) Distance (nm)
Processes: Mechanical response:
The main observable in DFS experiments is the velocity-dependent rupture force F(V) An adhesion bond is driven away from its equilibrium by a spring pulled at a given velocity. The barrier diminishes as the applied force increases. Rupture occurs via thermally assisted escape from the bound state across an activation barrier. The rupture force is determined by interplay between therate of escapein the absence of the force and thepulling velocity. The measured forces are not the intrinsic properties of molecules, but depend on theloading rateand mechanical setup.
To explore results of unbinding measurements we have to establish relationships between equilibrium properties of the system and the forces measured under nonequilibrium conditions.
For unbinding along a single reaction coordinate, it is usually assumed that Fmax(V) has the form: where k0 is the spontaneous rate of bond dissociation, and x is the distance from the minimum to the activation barrier of the reaction potential U(x).
The logarithmic law has been derived assuming that the pulling force produces a small constant bias which reduces the height of a potential barrier. Unbinding is described as an activated crossing of a barrier, which is reduced due to the pulling force Fpul Then the average enforced rate of crossing the barrier is These equations givelogarithmic dependence of the force on the pulling velocity
The Model The dynamic response of the bound complex is governed by the Langevin equation The molecule of mass M is pulled by a linker of a spring constant K moving at a velocityV. U(x) is the adhesion potential, x is a dissipation constant and the effect of thermal fluctuations is given by a random force x(t), which is -correlated . PNAS, 100, 11378 (2003)
Analytical model Total potential: In the absence of thermal fluctuations unbinding occurs only when the potential barrier vanishes: Φ(x) At this point the measured force, reaches its maximum value F=Fc.
In the presence of fluctuations the escape from the potential well occurs earlier, and the probability W(t) that a molecule persists in its bound state is defined by the Kramer’s transition rate:
Close to the critical force Fc at which the barrier disappears completely the instantaneous barrier height and the oscillation frequencies can be written as
The experimentally measured mean maximal force,<Fmax>, and distribution of unbinding forces, P(Fmax), can be expressed in terms of W as
Maximal spring force: => F(V) ~ (lnV)2/3 as compared with
with Theory predicts a universal scaling, independent of temperature, of Results of numerical calculations supporting the scaling behavior of the ensemble averaged rupture force. The inset shows a significantly worse scaling for the description <Fmax> ~ const – ln(V/T). (The units of velocity Vare nm/sec, temperature is in degrees Kelvin.) .
REBINDING Time series of the spring force showing the rebinding events for T=293K, V=5.9 nm/sec. Total potential,
Distribution of unbinding forces Normalized distribution of the unbinding force at temperature T=293K for two values of the velocity. The result from the numerical simulation (points) is in a good agreement with the analytical equation, for velocity V=117 nm/c. For velocity V=5.9 nm/sec, where the rebinding plays an essential role, the distribution function deviates from the one given above.
Lipase B From Candida Antarctica (CALB) Activity(The groups of de Schryver and Nolte) The enzyme (CALB) is immobilized. The substrate diffuses in the solution During the experiment, a laser beamis focused on the enzyme, and the fluorescent state of a single enzyme is monitored. The Michaelis-Menten reaction
Experimental Output E (off) S (off) [E+S] (off) [E+P] (on) E’ (off) • ~30 minutes trajectories with detector resolution of 50 ns • The signal is the photon count value per bin size, a(t).
Analysis of The Digital Trajectory Time series of on-off events (blinking)
Analysisofthetrajectory Constructing the waiting time distributions by building histograms from the off and the on time durations off on These functions can not be obtained from bulk measurements
Relationship between the scheme and the two-state trajectory An internal property of the ‘system’ Each substate belongs either to the on or the off states. The number of substates in each of the states can be different and the connectivity may be complex Random walk in a kinetic scheme (more generally CTRW) We wish to learn as much as possible about the underlying kinetic scheme
Analysis Stretched exponential decay for the off waiting time PDF for three different [S] An independent check for the [S] effect regime.
Modeling E (off); state 1 S (off) [E+S] (off); state 2 [E+P] (on); state 3 Single-Molecule Michaelis-Menten [S] independent regime The enzyme can not catalyze the backward reaction: PS. The product molecules diffusion back to theconfocal focus can beneglected (as shown by control experiments). The waiting time PDFs for the scheme For this model the off state waiting time PDF is a peaked function with an exponential tail. This does not describe the experimental results.
Correlation Function A direct calculation of the correlation function
Theoretical calculation of the correlation function Calculating the correlation function for a two-state hopping process with arbitrary waiting time PDFs (a CTRW model) • C(t) for a stationary process: • The superscript ‘0’ indicates the first event PDF (renewal theory). • The propagator is calculated using exponential on time PDF
Theoretical calculation of the correlation function This calculation supplies another check for the validity of the experimental results.
What can one learn from two-state single moleculetrajectories? Reducible schemes (lack of correlations): • The functional form of the waiting time PDFS • Several possibilities for the on-off scheme connectivity Irreducible schemes (existence of correlations): • Calculating other functions from the trajectory, such as • looking on the ordered waiting times trajectory
Irreducible schemes A full analysis should be preformed as more information about the underlying kinetic scheme can be obtained Additional method
Multi off sub-states & exponential on-state waiting times Models The Independent Channel Model The Fluctuating Enzyme Model
Bunched fast events The ordered waiting time trajectory Extracting the scheme parameters
Discriminating between the models • The trajectory of off duration times • contains 104 events. • Local trends of grouped fast events (faster than 30 ms), with an average of8 ms per event. Each group contains onaverage 3-4 events with an overallduration time of 28 ms per group. • Binning the over all time of each of the grouped fast events, and building a histogram. • From this histogram an estimation • for an average fluctuation rate can • be extracted.
The fluctuating enzyme model accounts for the stretched exponential form • of the off-state waiting time PDF. • The model naturally gives the off-state waiting time PDF as a sum of weighted • exponentials. A hierarchy of the reaction rates is then implied. • Setting rm=r, the on-state waiting time PDF is a single exponential. • No coupling between the on sub-states. The fluctuating enzyme model can account for local trends in the off duration time trajectory.
On the first passage times and leapovers of Lévy flights 0 a 1. The question of First Passage Time (FPT) - first crossing of the target.2. The question of First Arrival Time (FAT) - first arrival time at the target3. The question of First Passage Leapover (FPL) - Leapover: how far from the target the particle lands. The FPL problem has been hardly investigated.
Here, we focus on the question of the first passage time, and first passage leapover, but.. Sparre Anderson theorem - FPT density decays as t-3/2 for any symmetric random walk, independent of the PDF of the step length It has been shown recently (A. V. Chechkin et. al. (2003)) that the method of images is inconsistent with the universality of t-3/2 The probability density of FAT differs from the density of FPT, namely:
Lévy stable probability laws Examples:
I. General Lévy motions Typical Trajectories
II. One-sided Lévy motions Typical trajectories I. Eliazar, J. Klafter, Physica A 336, 219-244 (2004)
First passage of one-sided Lèvy flight 3 ranges:α→0 FPT is an exponential distr.α→0.5 α→1 `