Download
1 / 25
250 likes | 409 Views
Water Quality of the Ochlocknee River. By: Scott White 01/07/2014. Question. What is the water quality of the Ochlocknee River and surrounding water bodies?. Abstract.

E N D
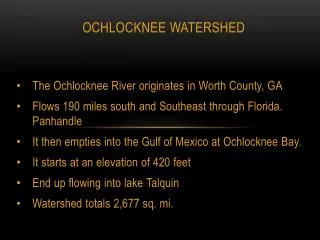
Water Quality of the Ochlocknee River By: Scott White 01/07/2014
Question What is the water quality of the Ochlocknee River and surrounding water bodies?
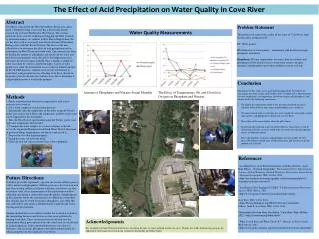
Abstract Water quality index encompasses several data sets including dissolved oxygen content, turbidity, total suspended particles, amount of fecal coliform, pH, biochemical oxygen demand, temperature, total phosphate and nitrates. By determining this value, the health of a water body ranging from poor to excellent is obtained. Poor water health includes low biodiversity and enormous stress on aquatic life while excellent health is quite the opposite. In this experiment, all of these data sets were obtained in ten different locations along the Ochlocknee River. Results from each location were compared in order to see if the water quality index differed from one location to the next or stayed relatively stable. Sources of water quality changes were explored if values differed greatly.
Background Water quality is the physical, chemical and biological characteristics of water. Water quality is measured in many factors like dissolved oxygen, the bacteria levels, salinity or the amount of material spread out in the water or in some areas the amount of concentration of algae pesticides, herbicides, metals and other contaminants.
Background - Continued Water Quality - PH In water quality you just cannot say the water is good or bad you have to say is it good for drinking can it be used for a carwash or some other purpose. Poor water quality can be harmful to you and the environment around you. Water quality is a scale measures through 100 and it includes nine different measurements; the pH of the water, dissolved oxygen content, turbidity, amount of fecal coliform, biochemical oxygen in the water, total phosphates, nitrates, total suspended solids. The pH of the water is measured 1 to 14 with seven being neutral. A normal stream pH ranges from 6 to 7.
Background Continued Turbidity Turbidity is the clarity of water how much material is in the water preventing the passage of light. Turbidity can also affect the dissolved oxygen of the water because of turbidity the water can heat up more and oxygen does not dissolve well in warm water. Turbidity can be useful in determining the effects of run off.
Background- Continued Biochemical Oxygen Biochemical oxygen is the measure of oxygen used by organisms in oxidation of organic matter. Runoff can carry pet waste, grass clippings and other chemicals humans might use. These materials raise the oxygen demand in the water and deplete the essential oxygen supply. The turbidity of water can be measured in two ways with an electronic turbidity meter or a turbidity tube. The units turbidity is measured in is called Nephelometric Turbidity Units (NTU) or Jackson Turbidity Units (JTLJ).
Background Continued Phosphates Phosphates are found naturally in water, plants need this element to grow. Sources of phosphorus include human industrial and animal wastes, soil erosion, and fertilizers. Excess phosphorus can cause rapid algae growth called blooms which can lead to a decrease of oxygen levels. There are several tests to determine the phosphorus in the water. One test is called the Total Phosphorous Test which measures every form of phosphorus. This is done by heating and acidifying the sample so all the other forms will become orthophosphate and it is measured by the ascorbic acid method.
Background - Continued Nitrate Electrode Method Nitrates are also essential to plant life. However if chemical levels become too high then there is an increase growth of only certain plants which decreases overall biodiversity. Large amounts of nitrates can cause hypoxia and can be toxic to warm-blooded animals. Normal nitrates levels in streams and rivers are usually low. Most of the nitrates that come from land sources usually run off into steams and dissolve in the streams faster than phosphorus. There are two methods on how to measure the nitrates including The Cadmium Reduction Method and The Nitrate Electrode Method. The Cadmium Reduction Method is where nitrates are reduced to nitrites. The nitrites react and turn to the sample a red color to indicate a positive result. The intensity of the red color is proportional to the number of nitrates. Then, The Nitrate Electrode Method contains a probe sensor to measure the nitrate activity.
Background Continued Suspended Solids Total suspended solids are substances in water such as silt, decaying plant and animal matter. A large amount of suspended solids in water can cause problems to the health of the water body and ultimately for aquatic life. Total suspended solids can reduce sunlight reaching the plant life and impact photosynthesis which also affects the amount of dissolved oxygen. Plants will then begin to die and decay reducing even more of the dissolved oxygen in the water. Water temperature rises with increased levels of suspended solids. With this increase, dissolved oxygen will decrease.
Background - continued Low Water Quality and Aquatic Life Low water quality will add stress to aquatic life and decrease the biodiversity in aquatic environments. By using pH, dissolved oxygen, total suspended solids, turbidity, phosphate and nitrate levels, the water quality can be determined. The goal of this experiment is to determine the water quality index of the local water body, the Ochlocknee River. By doing so, the health of aquatic plant and animal life can be determined.
Hypothesis The water quality index of the Ochlocknee River and surrounding water bodies is 25 to 50 indicating poor water health due to the potential runoff from the high volume of roadways and bridges.
Materials • Turbidity kit • Dissolved oxygen kit • Electronic pH tester • Nitrate/nitrite kit • Phosphate kit • Oven • Electric thermometer • Weight Measuring device • Glass or plastic bottles • Test tubes
Methods Water Samples Ten water samples with no air bubbles were collected from ten different locations along the river. A thermometer was used to check the temperature at each location. Next, pH was determined for each sample using an electronic pH detector. Dissolved oxygen was found for each sample using the Winkler Method. Eight drops of magnesium sulfate and eight drops of alkaline potassium iodide azide was added to the samples. A precipitate formed and was allowed to settle. One gram of sulfamic acid was added to the samples in order to fix the oxygen content. A titration was then accomplished by adding sodium thiosulfate one drop at a time until the sample retained a light yellow color. Starch indicator was then added one drop at a time until the solution turned clear in color. Each 0.1mL of thiosulfate used equaled 1 mg of dissolved oxygen per L of water.
Methods - Continued Turbidity Turbidity of each sample was found by comparing the samples with a turbidity-free water sample. This is called the Drop Count Method. Ten millimeters of water sample was added to a turbidity tube that contains a black dot at the bottom. The visibility of the black dot ranging for clear to cloudy was compared to the turbidity-free sample which has clear visibility. If cloudiness was detected, turbidity reagent was added to the clear sample in drops. The reagent was added drop-wise until the cloudiness in both samples was equal. The number of drops were recorded.
Methods - Continued Phosphate Levels The phosphate levels of each sample were obtained by adding 1 mL of Phosphate Acid Reagent and 0.1 gram of Phosphate Reducing Reagent to 10 mL of sample. Tubes of sample were placed in the Low Range Comparator with a Nitrate-N & Phosphate Low Range Comparator Bar. The comparator shined lighted through the samples. The color generated was matched to the comparator bar indicating phosphate levels.
Methods - Continued Nitrate Levels Nitrate levels were found using a similar method. 2.5 mL of Mixed Acid Reagent was added to equal part of water sample. Then, 0.1 gram of Nitrate Reducing Agent was added and the tube was inverted for ten minutes. The samples were placed in the Low Range Comparator and water color was compared to a standard color on the comparator bar as before. The reading was multiplied by 4.4 and recorded as ppm Nitrate.
Water Quality Index Biodiversity
Conclusion • In conclusion, the creeks and the Ochlocknee River where the samples came from were measured for their pH, turbidity, dissolved oxygen, nitrates, phosphates, total solids, and fecal coliform. These data sets were then imputed into an equation to find the overall water quality called the Water Quality Index. • The hypothesis stated that the water would have poor quality since bridges and roads were of high volume. However, this statement was rejected since the average water quality was 74.4. This value indicates that water quality was “good” meaning the water body has high biodiversity and little stress on aquatic life. The water samples that were gathered did not show that it was harming the vegetation or the animals living in it. The dissolved oxygen content was adequate for plant and animal life. The observation of diverse animal types including amphibians, reptiles, and insects supports the finding of high diversity. There was an absence of algal blooms which also implies healthy water quality.
Conclusion - Continued • In future experimentations, experimenters should use more creeks running into the larger river to adequately account for any excess pollution running into the river from these creeks. Also, samples should be taken closer to roads and highways as well as farther away to determine amount of runoff from the roads affecting the water quality. The water index was not at the highest level on the scale. Therefore, there is some excess material hindering the water quality slightly. Future experiments should dig deeper into this slight decline in health in order to maximize water quality as well as minimize the pollution source.
Results • From the data collected, sight 1 on the Water Quality Index was a 72, temperature 14.7 degrees Celsius, pH 7.97, turbidity 10 JTU, dissolved oxygen 6.4 ppm, the nitrates 4.4 ppm, phosphates 0.2 ppm, total solids 0.0214 and the coliform 3 ppm. Site 2 was a 79 on the Index scale, the temperature 14.7 degrees Celsius, the pH 7.96, turbidity 5 JTU, the dissolved oxygen 6.4 ppm, nitrate 0 ppm, Phosphate 0.2 ppm, the total solids 0.0105, and the fecal coliform 1. Site 3 on the Water Quality index measured a 72, temperature 13.5 degrees Celsius, the pH 8.22, turbidity 5 JTU, dissolved oxygen 7.8 ppm, nitrates 26.4 ppm, the phosphate 0.4, the total solid 0.0071, and the coliform was 0. Site 4 on the Water Quality Index measured 79, temperature 13.4 degrees Celsius, pH 8.22, turbidity 5 JTU, the dissolved oxygen 8 ppm, nitrates 0 ppm, phosphate 0, total solid 0, and coliform was 0.
Results - Continued • At sight 5, Water Quality Index was a 72 on the scale, temperature 14.7 degrees Celsius, pH 7.96, turbidity 5 JTU, dissolved oxygen 6.4 ppm, nitrate 0 ppm, Phosphate 0.2 ppm, total solids 0.0067, and the fecal coliform was 1 ppm. Site 6, the Water Quality Index was 70 on the index scale, temperature 17 degrees Celsius, pH 8.25, turbidity 30 JTU, dissolved oxygen 8.6 ppm, nitrates 44 ppm, phosphates 0.2 ppm, total solids 0.0051 and the coliform was 2 ppm. Site 7, the Water Quality Index was 73, the temperature 13.8 degrees Celsius, pH 8.23, turbidity 10 JTU, dissolved oxygen 6.6 ppm, nitrates 4.4 ppm, phosphates 0.2 ppm, total solids 0.0122 and the coliform was 1 ppm.
Results - Continued • At Site 8, the Water Quality Index was 72, temperature 13.8 degrees Celsius, pH 8.22, turbidity 5 JTU, dissolved oxygen was 6 ppm, nitrates 0 ppm, phosphates 0 ppm, total solids 0.0035 and the coliform was 5 ppm. Site 9, the Water Quality Index was 79 on the scale, temperature at the site 13.8 degrees Celsius, pH 8.22, turbidity 5 JTU, dissolved oxygen 6 ppm, nitrates 0 ppm, phosphates 0 ppm, total solids 0.0035 and the coliform was 1 ppm. Site 10, the Water Quality Index was 76 on the scale, the temperature 14.7 degrees Celsius, pH 8.27, turbidity 0 JTU, dissolved oxygen 6 ppm, nitrates 26.4 ppm, phosphates 0.4 ppm, total solids 0 and the coliform was.
Results - Continued • On average the Water Quality Index for the Ochlocknee River was 74.4 when the temperature, pH, turbidity, dissolved oxygen, nitrate and phosphate content along with total suspended solids and coliform content were added together.
Acknowledgements I would like to thank these people for helping me to do this experiment. • Mr. Beaty • Mr. Evans