Download

1 / 21
210 likes | 288 Views
Explore the variability of seismicity rates in the Bay Area over time, proposing a spatially-variable empirical model for forecasting seismic activity. Analyze historical data to make recommendations for adjusting rates for improved short-term forecasting. Assess how spatial variability impacts seismicity rates, highlighting the importance of updating seismicity maps for accurate predictions.

E N D
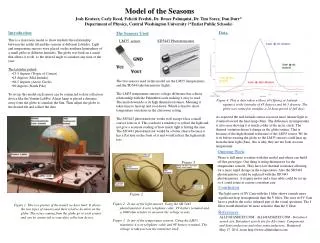
The Empirical Model Karen Felzer USGS Pasadena
A low modern/historical seismicity rate has long been recognized in the San Francisco Bay Area Stein 1999
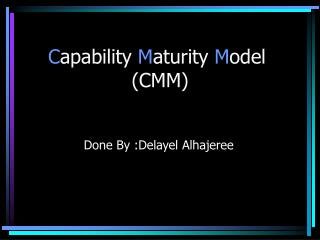
The Bay Area rate changes was carefully studied by WGCEP 2002 (Reasenberg et al., 2003). They found: • Average seismicity rates from 1850-1906 were 2.2 x above long term rates. • Rates from 1951-1998 were lower than 1850-1906 rates. • The rate change amplitude varied by fault. • No current physical model adequately explains the rate changes. • The rate changes have been fairly stable since 1951. • Final recommendation: Set all rates to 0.58 x long term rates for 2001-2031.
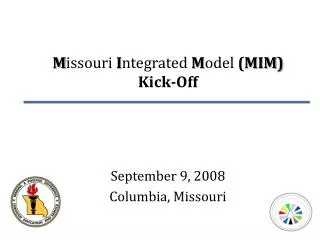
1850-1905 vs. 1951-1998 rates, by fault, as compared to the long term average Figure 8, Reasenberg et al. (2003) Note: Variability of rate change on different faults
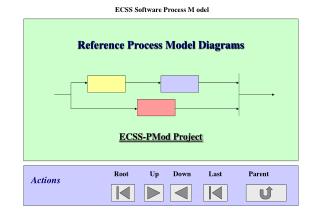
Seismicity rate plots as a function of time with various smoothing kernels Figure 5, Reasenberg et al. (2003) Rate Year Note: Rate >1951 fairly stable and deemed unlikely to change without a large earthquake
Important take-away points • Over ≥50 year periods seismicity rates can be relatively but significantly different from the long term average. • The change in rates throughout the San Francisco Bay Area is spatially variable
WGCEP 2008 found that the rate change actually extends over most of the state of California 0.66 0.79 0.64 Statewide:0.82 0.46 0.64 Results from WGCEP 2007, Appendix M *Average short term = average of 1906-2006, 1942-2006, and 1984-2006
Is this real? A low current seismicity rate statewide also agrees with geodetic/deformation studies “The western U.S. has been 37% below its long-term-average seismicity during 1977-2008” (Bird, 2009) “73-86% of the geodetic moment rate in California appears in the existing earthquake catalogue” (Ward, 1998)
However: The statewide seismicity rate decrease is spatially variable, with some areas above their long-term average Log(Smoothed Seismicity/Strain) 2 1932-2010 M≥4 seismicity divided by long term seismicity rate forecast of Bird (2009) 0 -2 Will a spatially variable empirical model forecast better?
A spatially variable, completely empirical model = smoothed seismicity Normalized log of rate This is the Helmstetteret al. approach, which is the winning the 5 year RELM forecasting test
Smoothed seismicity performs better than long term ratesover the last 1, 5, 10, and 50 years Correlation coefficient between forecast and realized seismicity rates
We look at the performance of the 5 year smoothed seismicity forecast in detail Correlation coefficient between forecast and realized seismicity rates
Performance of 1932-2005 smoothed seismicity forecast for 2006-2010 2006-10 smoothed seismicity /forecast for last 5 years
We might be able to improve performance with aftershock and fault modeling 2006-2010 smoothed seismicity /forecast for last 5 years Decay of Landers/Hector Mine aftershocks could be corrected for Aftershocks could be placed preferentially on high slip faults Baja aftershocks could be added
Can the spatially variable empirical model be applied to the largest earthquakes?
Most of the statewide rate decrease comes from the San Andreas fault 1932-2010 M≥4 seismicity vs. long term seismicity rate forecast of Bird (2009)
Overall the San Andreas should host at least ~40% of California’s M≥7 earthquakes M≥7 earthquake record south of the triple junction >1906 The absence of M≥7earthquakes from the San Andreas is significant at 95% confidence
Proposal for change Old Method New Method Start with smoothed seismicity rates. Simulate where aftershocks might occur over the forecast period, and add aftershocks in real time. Adjust azimuth of smoothing kernel for spontaneous events and aftershocks to produce more events where long term rates are high (on faults!) • Start with long term slip rate, known-faults based model + smoothed seismicity. • Move all rates up or down to empirically fit modern catalog. Goal: Forecast where seismicity will occur in the short term, match the long term model over the long term
Conclusions • We observe that regional seismicity rates vary significantly from their long term rates over periods at least as long as 50 years. Propagating empirically observed rate changes has historically produced a better forecast. • The rate changes appear to apply to M≥7 earthquakes. • Simple smoothed seismicity maps may provide the best forecasts for ≤50 year periods provided that the map is updated as aftershocks occur with input from the long term slip model.
The statewide rate decrease can also be seen if we just look at larger earthquakes Statewide, rate of M≥6.0 1857-1927 is ~65% of 1927-2006
Smoothed seismicity performs better than long term ratesover the last 1, 5, 10, and 50 years Fraction of bins in which forecast and realized rates agree by >50%: