Download
1 / 1
10 likes | 122 Views
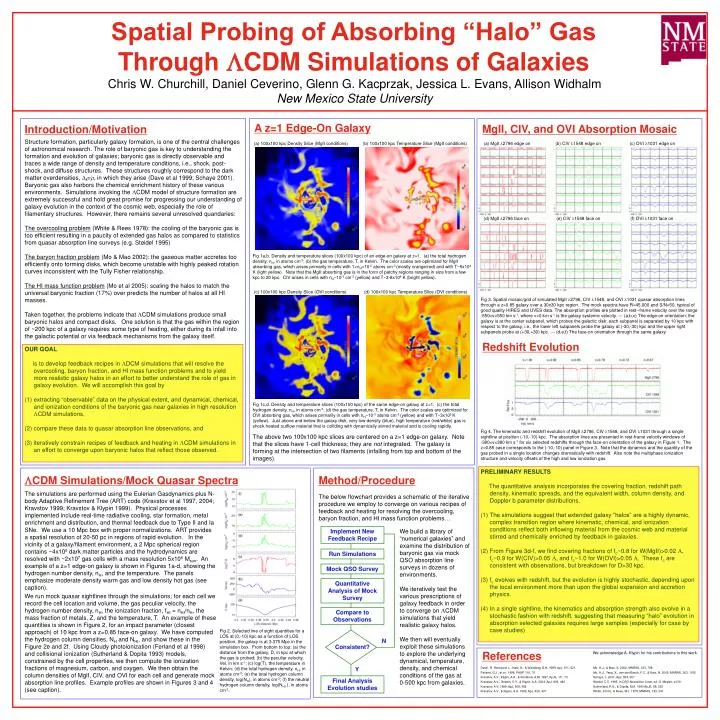
Spatial Probing of Absorbing “Halo” Gas Through CDM Simulations of Galaxies. Chris W. Churchill, Daniel Ceverino, Glenn G. Kacprzak, Jessica L. Evans, Allison Widhalm New Mexico State University. A z=1 Edge-On Galaxy. MgII, CIV, and OVI Absorption Mosaic. Introduction/Motivation.

E N D
Spatial Probing of Absorbing “Halo” Gas Through CDM Simulations of Galaxies Chris W. Churchill, Daniel Ceverino, Glenn G. Kacprzak, Jessica L. Evans, Allison Widhalm New Mexico State University A z=1 Edge-On Galaxy MgII, CIV, and OVI Absorption Mosaic Introduction/Motivation Structure formation, particularly galaxy formation, is one of the central challenges of astronomical research. The role of baryonic gas is key to understanding the formation and evolution of galaxies; baryonic gas is directly observable and traces a wide range of density and temperature conditions, i.e., shock, post-shock, and diffuse structures. These structures roughly correspond to the dark matter overdensities, in which they arise (Dave et al 1999; Schaye 2001). Baryonic gas also harbors the chemical enrichment history of these various environments. Simulations invoking the CDM model of structure formation are extremely successful and hold great promise for progressing our understanding of galaxy evolution in the context of the cosmic web, especially the role of filamentary structures. However, there remains several unresolved quandaries: The overcooling problem (White & Rees 1978): the cooling of the baryonic gas is too efficient resulting in a paucity of extended gas halos as compared to statistics from quasar absorption line surveys (e.g. Steidel 1995) The baryon fraction problem (Mo & Mao 2002): the gaseous matter accretes too efficiently onto forming disks, which become unstable with highly peaked rotation curves inconsistent with the Tully Fisher relationship. The HI mass function problem (Mo et al 2005): scaling the halos to match the universal baryonic fraction (17%) over predicts the number of halos at all HI masses. Taken together, the problems indicate that CDM simulations produce small baryonic halos and compact disks. One solution is that the gas within the region of ~200 kpc of a galaxy requires some type of heating, either during its infall into the galactic potential or via feedback mechanisms from the galaxy itself. (a) 100x100 kpc Density Slice (MgII conditions) (b) 100x100 kpc Temperature Slice (MgII conditions) (a) MgII 2796 edge on (b) CIV 1548 edge on (c) OVI 1031 edge on (d) MgII 2796 face on (e) CIV 1548 face on (f) OVI 1031 face on Fig 1a,b. Density and temperature slices (100x100 kpc) of an edge-on galaxy at z=1. (a) the total hydrogen density, nH, in atoms cm-3; (b) the gas temperature, T, in Kelvin. The color scales are optimized for MgII absorbing gas, which arises primarily in cells with 1<nH<10-2 atoms cm-3 (mostly orange/red) and with T~5x10⁴ K (light yellow). Note that the MgII absorbing gas is in the form of patchy regions ranging in size from a few kpc to 20 kpc. CIV arises in cells with nH~10-3 cm-3 (yellow) and T~3-8x10⁴ K (bright yellow). (c) 100x100 kpc Density Slice (OVI conditions) (d) 100x100 kpc Temperature Slice (OVI conditions) Fig 3. Spatial mosaic/grid of simulated MgII 2796, CIV 1548, and OVI 1031 quasar absorption lines through a z=0.85 galaxy over a 30x30 kpc region. The mock spectra have R=45,000 and S/N=50, typical of good quality HIRES and UVES data. The absorption profiles are plotted in rest--frame velocity over the range -550<v<550 km s-1, where v=0 km s-1 is the galaxy systemic velocity. --- (a,b,c) The edge-on orientation; the galaxy is at the center subpanel, which probes the galactic disk; each subpanel is separated by 10 kpc with respect to the galaxy, i.e., the lower left subpanels probe the galaxy at (-30,-30) kpc and the upper right subpanels probe at (+30,+30) kpc. --- (d,e,f) The face-on orientation through the same galaxy. Redshift Evolution OUR GOAL is to develop feedback recipes in DCM simulations that will resolve the overcooling, baryon fraction, and HI mass function problems and to yield more realistic galaxy halos in an effort to better understand the role of gas in galaxy evolution. We will accomplish this goal by extracting “observable” data on the physical extent, and dynamical, chemical, and ionization conditions of the baryonic gas near galaxies in high resolution CDM simulations, compare these data to quasar absorption line observations, and iteratively constrain recipes of feedback and heating in CDM simulations in an effort to converge upon baryonic halos that reflect those observed. Fig 1c,d. Density and temperature slices (100x100 kpc) of the same edge-on galaxy at z=1. (c) the total hydrogen density, nH, in atoms cm-3; (d) the gas temperature, T, in Kelvin. The color scales are optimized for OVI absorbing gas, which arises primarily in cells with nH~10-3 atoms cm-3 (yellow) and with T~3x10⁵ K (yellow). Just above and below the galaxy disk, very low density (blue), high temperature (red/white) gas is shock heated outflow material that is colliding with dynamically stirred material and is cooling rapidly. Fig 4. The kinematic and redshift evolution of MgII 2796, CIV 1548, and OVI 1031 through a single sightline at position (-10,-10) kpc. The absorption lines are presented in rest-frame velocity windows of -380<v<380 km s-1 for six selected redshifts through the face-on orientation of the galaxy in Figure 1. The z=0.85 case corresponds to the (-10,-10) panel in Figure 3. Note that the dynamics and the quantity of the gas probed in a single location changes dramatically with redshift. Also note the multiphase ionization structure and velocity offsets of the high and low ionization gas. The above two 100x100 kpc slices are centered on a z=1 edge-on galaxy. Note that the slices have 1-cell thickness; they are not integrated. The galaxy is forming at the intersection of two filaments (infalling from top and bottom of the images). PRELIMINARY RESULTS The quantitative analysis incorporates the covering fraction, redshift path density, kinematic spreads, and the equivalent width, column density, and Doppler b parameter distributions. The simulations suggest that extended galaxy “halos” are a highly dynamic, complex transition region where kinematic, chemical, and ionization conditions reflect both inflowing material from the cosmic web and material stirred and chemically enriched by feedback in galaxies. From Figure 3d-f, we find covering fractions of fc~0.8 for W(MgII)>0.02 , fc~0.9 for W(CIV)>0.05 and fc~1.0 for W(OVI)>0.05 These fc are consistent with observations, but breakdown for D>30 kpc. fc evolves with redshift, but the evolution is highly stochastic, depending upon the local environment more than upon the global expansion and accretion physics. In a single sightline, the kinematics and absorption strength also evolve in a stochastic fashion with redshift, suggesting that measuring “halo” evolution in absorption selected galaxies requires large samples (especially for case by case studies) CDM Simulations/Mock Quasar Spectra Method/Procedure The simulations are performed using the Eulerian Gasdynamics plus N-body Adaptive Refinement Tree (ART) code (Kravstov et al 1997, 2004; Kravstov 1999; Kravstov & Klypin 1999). Physical processes implemented include real-time radiative cooling, star formation, metal enrichment and distribution, and thermal feedback due to Type II and Ia SNe. We use a 10 Mpc box with proper normalizations. ART provides a spatial resolution of 20-50 pc in regions of rapid evolution. In the vicinity of a galaxy/filament environment, a 2 Mpc spherical region contains ~4x10⁵ dark matter particles and the hydrodynamics are resolved with ~2x10⁷ gas cells with a mass resolution 5x10⁶ Msun. An example of a z=1 edge-on galaxy is shown in Figures 1a-d, showing the hydrogen number density, nH, and the temperature. The panels emphasize moderate density warm gas and low density hot gas (see caption). (f) The below flowchart provides a schematic of the iterative procedure we employ to converge on various recipes of feedback and heating for resolving the overcooling, baryon fraction, and HI mass function problems… (e) Implement New Feedback Recipe We build a library of “numerical galaxies” and examine the distribution of baryonic gas via mock QSO absorption line surveys in dozens of environments. We iteratively test the various prescriptions of galaxy feedback in order to converge on CDM simulations that yield realistic galaxy halos. We then will eventually exploit these simulations to explore the underlying dynamical, temperature, density, and chemical conditions of the gas at 0-500 kpc from galaxies. (d) Run Simulations (c) Mock QSO Survey Future Work (b) Quantitative Analysis of Mock Survey We run mock quasar sightlines through the simulations; for each cell we record the cell location and volume, the gas peculiar velocity, the hydrogen number density, nH, the ionization fraction, fHI = nHI/nH, the mass fraction of metals, Z, and the temperature, T. An example of these quantities is shown in Figure 2, for an impact parameter (closest approach) of 10 kpc from a z=0.85 face-on galaxy. We have computed the hydrogen column densities, NH and NHI, and show these in the Figure 2e and 2f. Using Cloudy photoionization (Ferland et al 1998) and collisional ionization (Sutherland & Dopita 1993) models, constrained by the cell properties, we then compute the ionization fractions of magnesium, carbon, and oxygen. We then obtain the column densities of MgII, CIV, and OVI for each cell and generate mock absorption line profiles. Example profiles are shown in Figures 3 and 4 (see caption). (a) Compare to Observations Fig 2. Selected line of sight quantities for a LOS at (0,-10) kpc as a function of LOS position; the galaxy is at 3.375 Mpc in the simulation box. From bottom to top: (a) the distance from the galaxy, D, in kpc at which the gas is probed; (b) the peculiar velocity, Vel, in km s-1; (c) log(T), the temperature in Kelvin; (d) the total hydrogen density, nH, in atoms cm-3; (e) the total hydrogen column density, log(NH), in atoms cm-2; (f) the neutral hydrogen column density, log(NHI ), in atoms cm-2. N Consistent? References We acknowledge A. Klypin for his contributions to this work. Y Dave’, R. Hernquist, L., Katz, N., & Weinberg, D.H. 1999, ApJ, 511, 521 Ferland, G.J., et al . 1998, PASP, 110, 76 Kravstov, A.V., Klypin, A.A., & Khokholv, A.M. 1997, ApJS, 111, 73 Kravstav, A.V., Gnedin, O.Y., & Klypin, A.A. 2004, ApJ, 609, 482 Kravstov, A.V. 1999, ApJ, 609, 482 Kravstov, A.V., & Klypin, A.A. 1999, ApJ, 520, 437 Mo. H.J., & Mao, S. 2002, MNRAS, 333, 768 Mo, H.J., Yang, X., van den Bosch, F.C., & Katz, N. 2005, MNRAS, 363, 1155 Schaye, J. 2001, ApJ, 559, 507 Steidel, C.C. 1995, in QSO Absorption Lines, ed. G. Meylan, p139 Sutherland, R.S., & Dopita, M.A. 1993 ApJS, 88, 253 White, S.D.N., & Rees, M.J. 1978, MNRAS, 183, 341 Final Analysis Evolution studies