Download
1 / 16
160 likes | 280 Views
Laredo Bridge System. Budget Presentation FY 2009-2010. Budget Highlights. FY 08-09 $6 million shortfall of revenues, 13% Reduced operating budget - $6 million Meet 15% required fund balance, $1.7 million FY 09-10 Revenues and expenditures are similar to FY08-09

E N D
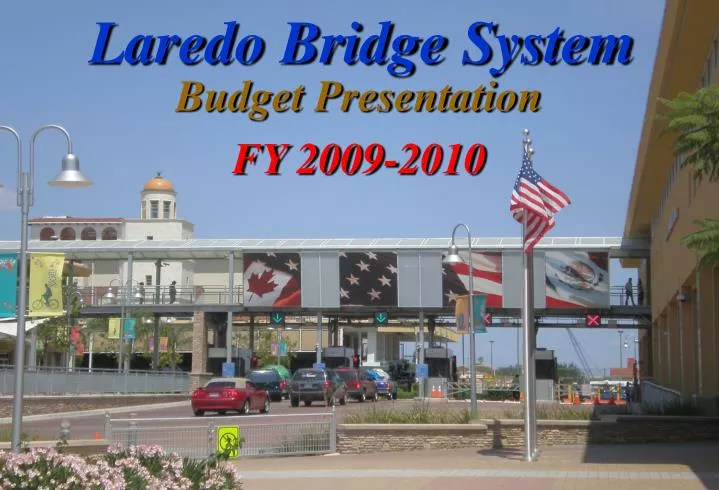
Laredo Bridge System Budget Presentation FY 2009-2010
Budget Highlights FY 08-09 • $6 million shortfall of revenues, 13% • Reduced operating budget - $6 million • Meet 15% required fund balance, $1.7 million FY 09-10 • Revenues and expenditures are similar to FY08-09 • Deleted $6m from proposed budget • Deleted 11 positions, unfunded 17 positions • Meet 15% required fund balance of $1.8 million • No rate increase proposed
Estimated Revenue FY08-09 $46,564,504 $40,511,119 -$6,053,485 -13 % Budget FY08-09 Estimated FY08-09
Proposed Revenue FY09-10 $40,511,119 $40,510,627 -$492 +.00 % Estimated FY08-09 Proposed FY09-10
5 Year Revenue Comparison $45,576,258 $39,101,761 $40,511,119 $40,510,627 $33,069,032 $38,051,562 +19.8% +18.2% - 13 % +0% - 2.7 % Proposed Estimated FY 04-05 FY 06-07 FY 09-10 FY 08-09 FY 05-06 FY 07-08 $1.00Increase Comm. & .40¢ Increase AVI toll rate Decrease in Non-Comm & Commercial 50¢ Increase Non-Com & Increase Com. Traffic Decrease in Pedestrian & Non-Comm. Decrease in Non-Comm & Commercial
TRAFFIC COMPARISONS
Yearly Commercial Traffic 1,699,732 1,662,549 1,608,566 1,384,975 1,384,975 - 2% -37,183 -3.2% -14 % -53,983 -223,591 FY 08-09 Estimated F`Y 09-10 Proposed FY 05-06 FY 06-07 FY 07-08
Border City Commercial Traffic ComparisonAs of May 31, 2009 33,428 - 24.3% 53,888 132,023 193,265 916,553 - 18.6% - 18.4% 274,611 - 15.2% - 13.9% 23,887 - 11.4% + .28% Del Rio Eagle Pass Laredo McAllen Brownsville El Paso Pharr
Yearly Non-Commercial Traffic 6,075,453 5,718,799 5,539,281 -355,654 5,018,589 5,018,589 -179,518 - 6% -520,692 - 3.1% - 9.4% FY 07-08 FY 08-09 Estimated FY 05-06 FY 06-07 FY09-10 Proposed
BorderCity Non-Commercial Traffic Comparison As of May 31, 2009 2,395,190 -14.8% 2,617,840 3,407,780 3,024,607 -13.6% 996,636 -9.4% -9.4% 1,799,328 1,074,171 -7.48% -5.1% -3.7% Del Rio Pharr El Paso Brownsville Laredo McAllen Eagle Pass
Yearly Pedestrian Traffic 4,362,476 200,953 4,157,440 4,157,440 +4.8 4,161,523 4,137,543 +23,980 -205,036 + .60% - 4.7% FY 08-09 Estimated FY 09-10 Proposed FY 07-08 FY 05-06 FY 06-07
Border City Pedestrian Traffic Comparison As of May 31, 2009 40,323 1,248,915 10.8% -7.1% 451,960 3,430,866 2,814,147 -4.6% -4.7% -5.2% 1,070,673 -.31% El Paso McAllen Brownsville Laredo Eagle Pass Del Rio
Thank You. Mario Maldonado Bridge Manager