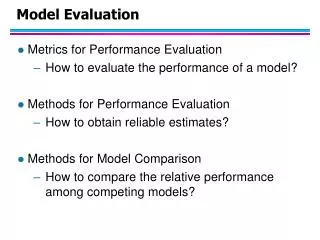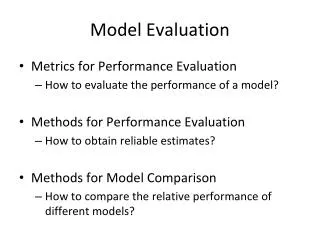
Model Evaluation
Model Evaluation. Saed Sayad. Data Mining Steps. Model Evaluation. Classification - Confusion Matrix. Positive Cases. Negative Cases. Predicted Positive. Predicted Negative. Confusion Matrix - Evaluation Measurements. Actual. Predicted. Sensitivity and Specificity.

Model Evaluation
E N D
Presentation Transcript
Model Evaluation Saed Sayad www.ismartsoft.com
Data Mining Steps www.ismartsoft.com
Model Evaluation www.ismartsoft.com
Classification - Confusion Matrix Positive Cases Negative Cases Predicted Positive Predicted Negative www.ismartsoft.com
Confusion Matrix -Evaluation Measurements Actual Predicted
Sensitivity and Specificity www.ismartsoft.com
Classification – Gain Chart Target% Wizard 100% Model Random Population% 0% 50% 100% www.ismartsoft.com
Gain Chart Target% Wizard 100% A 50% Random 10% Population% 10% 18% 50% 100% www.ismartsoft.com
Gain Chart Score Table Sorted by Score Gain Table www.ismartsoft.com
Classification – Gain Chart Target% 100% A 85% 76% B 66% 54% 36% Population% 10% 20% 30% 40% 50% 100% www.ismartsoft.com
Lift Chart Lift Table Gain Table www.ismartsoft.com
Lift Chart Lift Population% www.ismartsoft.com
K-S Chart (Kolmogorov-Smirnov) K-S K(0.95) = 6.0% K(0.99) = 7.1% www.ismartsoft.com
K-S Chart Count% Score www.ismartsoft.com
ROC Chart(Receiver Operating Characteristic) www.ismartsoft.com
ROC Chart Sensitivity 1-Specificity www.ismartsoft.com
Regression – Mean Squared Error www.ismartsoft.com
Regression – Relative Squared Error www.ismartsoft.com
Regression – Mean Absolute Error www.ismartsoft.com
Regression – Relative Absolute Error www.ismartsoft.com
Regression – Standardized Residuals Plot www.ismartsoft.com
Questions? www.ismartsoft.com