State Teacher Evaluation Model
State Teacher Evaluation Model. Professional Practice. Student Growth. 50 % Qualitative Measures Domain percentages proposed by LEA and approved by MSDE. 50 % Quantitative Measures As defined below. Planning and Preparation 12.5%. Instruction 12.5%. Classroom Environment 12.5%.

State Teacher Evaluation Model
E N D
Presentation Transcript
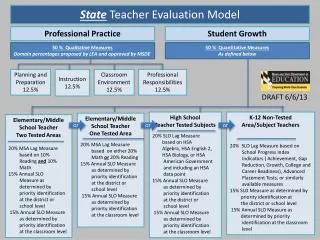
StateTeacher Evaluation Model Professional Practice Student Growth 50 % Qualitative Measures Domain percentages proposed by LEA and approved by MSDE 50 % Quantitative Measures As defined below Planning and Preparation 12.5% Instruction 12.5% Classroom Environment 12.5% Professional Responsibilities 12.5% DRAFT 6/6/13 High School Teacher Tested Subjects 20% SLO Lag Measure based on HSA Algebra, HSA English 2, HSA Biology, or HSA American Government and including an HSA data point 15% Annual SLO Measure as determined by priority identification at the district or school level 15% Annual SLO Measure as determined by priority identification at the classroom level K-12 Non-Tested Area/Subject Teachers 20% SLO Lag Measure based on School Progress Index Indicators ( Achievement, Gap Reduction, Growth, College and Career Readiness), Advanced Placement Tests, or similarly available measures 15% SLO Measure as determined by priority identification at the district or school level 15% Annual SLO Measure as determined by priority identification at the classroom level Elementary/Middle School Teacher One Tested Area 20% MSA Lag Measure based on either 20% Math or 20% Reading 15% Annual SLO Measure as determined by priority identification at the district or school level 15% Annual SLO Measure as determined by priority identification at the classroom level Elementary/Middle School Teacher Two Tested Areas 20% MSA Lag Measure based on 10% Reading and 10% Math 15% Annual SLO Measure as determined by priority identification at the district or school level 15% Annual SLO Measure as determined by priority identification at the classroom level or or or
State Principal Evaluation Model Professional Practice Student Growth 50% Qualitative Measures 12 Domains Each 2-10% 50% Quantitative Measures As defined below • Maryland Instructional Leadership Framework (8) • School Vision • School Culture • Curriculum, Instruction, and Assessment • Observation/Evaluation of Teachers • Integration of Appropriate Assessments • Use of Technology and Data • Professional Development • Stakeholder Engagement • Interstate School Leaders and Licensure Consortium (4) • School Operations and Budget • Effective Communication • Influencing the School Community • Integrity, Fairness, and Ethics DRAFT 6/6/13 High School Principals 20% SLO Lag Measure as determined by 10% HSAs and 10% AP scores, SPI Indicators (Gap Reduction, College & Career Readiness, Achievement), or similar valid delayed measures 10% School Progress Index 10% Annual SLO Measure as determined by priority identification at the district level 10% Annual SLO Measure as determined by priority identification at the school level Elementary/Middle School Principals 20% MSA Lag Measure as determined by 10 % Reading MSA and 10% Math MSA 10% School Progress Index 10% Annual SLO Measure as determined by priority identification at the district level 10% Annual SLO Measure as determined by priority identification at the school level Other Principals (e.g., Special Center, PreK-2) 20% SLO Lag Measure as determined by 10% HSAs and 10% AP scores, SPI Indicators (Gap Reduction, College & Career Readiness, Achievement), or similar valid delayed measures 10% School Progress Index 10% Annual SLO Measure as determined by priority identification at the district level 10% Annual SLO Measure as determined by priority identification at the school level or or
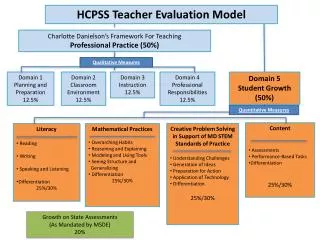
LocalTeacher Evaluation Models 2013-2014* Professional Practice Student Growth 50 % Qualitative Measures Domain percentages proposed by LEA and approved by MSDE 50 % Quantitative Measures As defined below Planning and Preparation Instruction Classroom Environment Professional Responsibilities Additional Domains Based on Local Priorities DRAFT 6/6/13 Elementary/Middle School Teacher Two Content Areas Either 5 % - Reading MSA (Class) 5 % - Math MSA (Class) 10%- School Progress Index or 10%- Reading MSA (Class) 10%- Math MSA (Class) and 30% - LEA proposed objective measures of student growth and learning linked to state and/or local goals and approved by MSDE Elementary/Middle School Teacher One Content Area Either 10% - Reading MSA (Class) or Math MSA (Class) 10% -School Progress Index or 20% -Reading MSA (Class) or Math MSA (Class and 30% - LEA proposed objective measures of student growth and learning linked to state and/or local goals and approved by MSDE High School Teacher LEA proposed objective measures of student growth and learning linked to state and/or local goals and approved by MSDE; no single measure to exceed 35% . For tested area teachers, one Student Learning Objective must include an HSA data point. Elementary/Middle School Teacher Non-Tested Subject LEA proposed objective measures of student growth and learning linked to state and/or local goals and approved by MSDE; no single measure to exceed 35% . or or or * MSA/SPI split increases to 15%/5% in 2014-2015 and becomes 20% MSA/PARCC in 2015-2016
LocalPrincipal Evaluation Models 2013-2014* Professional Practice Student Growth 50 % Qualitative Measures Domain percentages proposed by LEA and approved by MSDE 50 % Quantitative Measures As defined below • Maryland Instructional Leadership Framework (8) • School Vision • School Culture • Curriculum, Instruction, and Assessment • Observation/Evaluation of Teachers • Integration of Appropriate Assessments • Use of Technology and Data • Professional Development • Stakeholder Engagement Additional Domains Based on Local Priorities DRAFT 6/6/13 • Elementary & Middle School Principals • Either • 5 % - Reading MSA (School) • 5 % - Math MSA (School) • 10%-School Progress Index • or • 10%- Reading MSA (School) • 10%- Math MSA (School) • and • 30% - LEA proposed objective measures of student growth and learning linked to state and/or local goals and approved by MSDE Other Principals (e.g., Special Center, PreK-2) LEA proposed objective measures of student growth and learning linked to state and/or local goals and approved by MSDE; no single measure to exceed 35%. If appropriate, one Student Learning Objective must be targeted at HSAs. High School Principals LEA proposed objective measures of student growth and learning linked to state and/or local goals and approved by MSDE; no single measure to exceed 35%. One Student Learning Objective must be targeted at HSAs. or or * MSA/SPI split increases to 15%/5% in 2014-2015 and becomes 20% MSA/PARCC in 2015-2016