Download
1 / 12
120 likes | 136 Views
This report updates the Chesapeake BIBI for stream health, evaluating metric sensitivity, genus-level data, and bioregion representation. The study focuses on improving stream health above 2008 baseline levels in conjunction with the Technical Advisory Group.

E N D
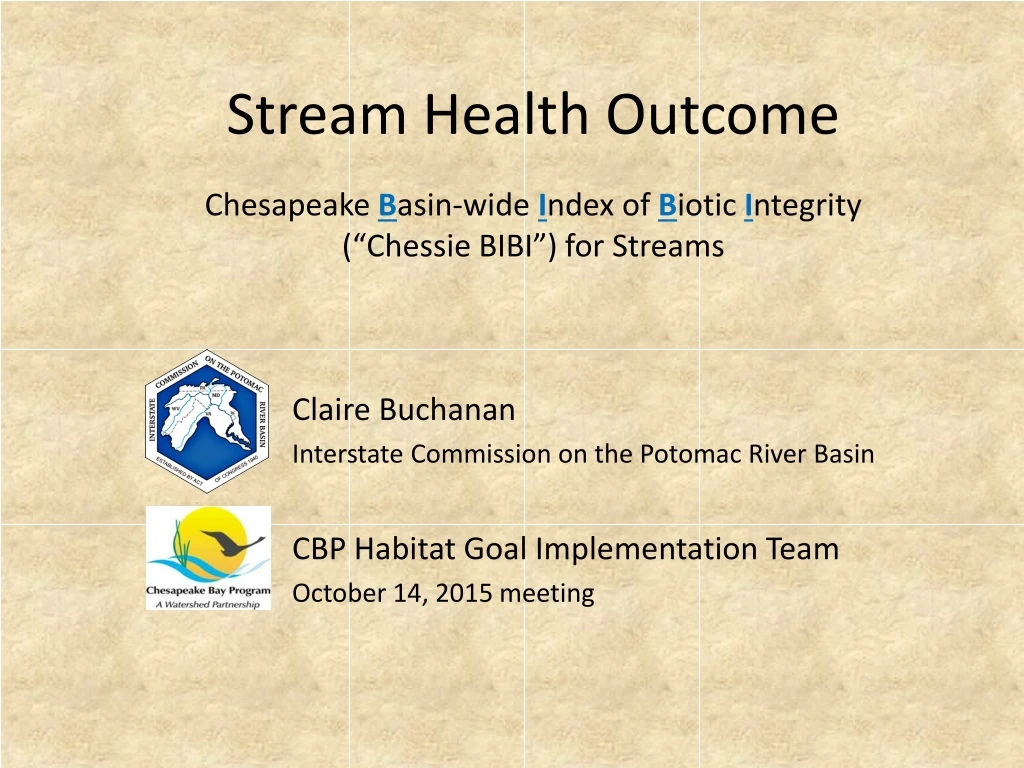
Chesapeake Basin-wide Index of Biotic Integrity (“Chessie BIBI”) for Streams Stream Health Outcome Claire Buchanan Interstate Commission on the Potomac River Basin CBP Habitat Goal Implementation Team October 14, 2015 meeting
Update and Refine Index Management Approach 1, #1 • Updated database (add 2011–present data) • Metric and index calculations • Index sensitivity • Bioregion under-representation • Genus-level metrics Final Report expected September 2016
Establish 2008 Baseline and Trend Approach Management Approach 1, #2 Required for CBP goal: Continually improve stream health and function throughout the watershed. Improve health and function of 10 percent of stream miles above the 2008 baseline for the Chesapeake Bay watershed. Will be done in conjunction with Technical Advisory Group Results will be included in September 2016 Final Report
Q: How to report stream health for an entire region? Measure change? "Figures often beguile me, particularly when I have the arranging of them myself; in which case the remark attributed to Disraeli would often apply with justice and force: 'There are three kinds of lies: lies, damned lies, and statistics.'“ Mark Twain (1906) from Chapters From My Autobiography
Q: How to report stream health for an entire region? Measure change? Excellent Good Fair Poor Very Poor A • Three examples from the same hypothetical data set • Samples from 26 random-stratified sites are collected in 5 hypothetical watersheds (A-E), and represent an entire region • Several overlapping monitoring programs collected the data • Watersheds C and D have small areas but lots of samples. Watersheds A and E are larger but each only has a few samples Station Rankings B C D E
Example C Simple summation - current CBP pie chart method A B C D E Conclusion: 38.5% of stream sites are Poor or Very Poor 61.5% are Fair or better
Example B Area-weighting by watershed area using the average score – current CBP mapping approach A B C D Conclusion: 17.2% of region’s area has an average score of Poor; none are V. Poor 82.8% has an average score of Fair or better Area-weight average for region is 45.1% (Fair) E
Example A Weighting by stream miles using proportions of scores A B C D Conclusion: 29.8% of stream miles are Poor or V. Poor 60.2% are Fair or better Mile-weighted average score for region is 45.2% (Fair) E
1. You are stuck with the data you have... 2. The choice of statistic -- and how that statistic is calculated -- will reflect the underlying question. Be sure of the underlying question.