Download

1 / 16
160 likes | 216 Views
Demonstrate estimating well productivity with gas condensate rate equation accounting for condensate blockage. A detailed worked example using sensor simulation data is provided to estimate gas and condensate production rates and skin. The method involves calculating gas-oil relative permeability, pseudopressure integral, and adjusting for velocity-dependent relative permeabilities to improve accuracy.

E N D
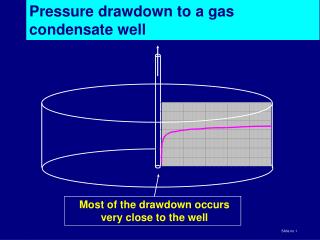
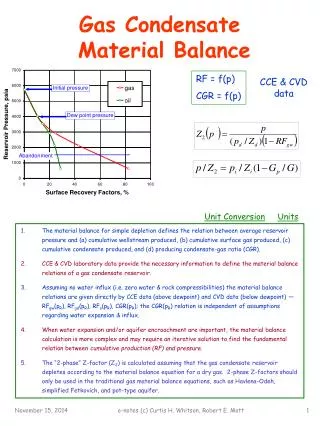
Gas Condensate Rate Equation A worked example to demonstrate the use of the gas condensate rate equation to estimate well productivity, taking account of condensate blockage. The data will be taken from a Sensor simulation model to allow comparison with simulation results.
Statement of problem (1) A well in a lean gas condensate reservoir has with these properties kh = 1,000 md ft rw = 0.33 ft re = 3000 ft Mechanical skin = 0 Average reservoir pressure = 3965 psia Wellbore flowing BHP = 1545 psia Lean gas condensate (PVT properties on next slide), flowing OGR = 26 stb/MMscf ‘Rock’ rel perms, with Corey exponent of 3 (data on slide 4) Assume oil saturation = 1% outside near-well region These conditions correspond to this Sensor simulation case after 3 years (1095 days) 10 md, rock rel perms
Statement of problem (2) • Estimate the maximum gas production rate for the well. • Estimate the condensate blockage skin
PVT properties Dew point pressure of fluid with OGR = 26 stb/Mmscf = 3734 psi
Step 1. Estimate krg/kro from PVT properties rp= flowing OGRAll other properties from PVT tables For a fluid with rp = 26 stb/MMscf, dew point pressure = 3734 psi (estimated from PVT table). This is the pressure at the outer edge of Region 1 (P*). The equation only applies below the dew point pressure. Above the dew point pressure, kro = 0 and krg/kro = infinity.
Step 3. Calculate the term inside the pseudopressure integral For field units, the conversion factor c is 0.001127
Step 3. Calculate the term inside the pseudopressure integral For a lean gas condensate, the second term is very small and can be neglected (< 1% in this example)
Step 4. Calculate the pseudopressure integral – the area under the Gas mobility vs Pressure curve Gas mobility lg This point estimated by extrapolation The mobility vs pressure curve has a discontinuity at dew point pressure – need to allow for this when evaluating the integral.
Step 4. Calculate the pseudopressure integral Evaluating the integral by the trapezoid rule gives = 25,117 psi.Mscf/rb/cp This gives a gas flow rate of 21.3 MMscf/d. The gas flow rate from Sensor = 21.5 MMscf/d
Step 5. Estimate the condensate blockage skin Recalculate the gas mobility lg(P) assuming krg=0.96, kro =0. The pseudopressure integral is now 90,100 psi.Mscf/rb/cp. Calculate the skin from The condensate blockage skin = 21.6. In practice, this is almost certainly too high as it ignores the effect of velocity-dependent rel perms. Spreadsheet with calculations
How can we include the effect of velocity dependent rel perms? • Guess the gas production rate. • this is needed to calculate velocity • For each pressure in the pseudopressure integral • Estimate the radius by assuming P~ln(radius) • Estimate the Darcy velocity at this radius • Estimate the capillary number (will also need IFT as a function of pressure) • Adjust the krg vs krg/kro relationship using the Fevang-Whitson correlation (Ref 2). • Calculate the pseudopressure integral and the gas production rate. • Repeat if gas production rate is very different from original guess.
Pseudopressure integral with velocity dependent rel perms With vel-dep kr With rock kr Gas production rate with velocity dependent rel perms is about 31 MMscf/d – a blockage skin of about 12.
References • Modeling Gas Condensate Well Deliverability • Gas Condensate Relative Permeability for Well Calculations • Engineering Calculations of Gas Condensate Well Productivity Notes