Download
1 / 18
180 likes | 335 Views
A network scan of horizontal road geometry. Desmond O’Connor spatial data analyst. What is it about?. its about … exploiting existing spatial data sources utilise GPS data & patterns within the data relating these patterns to road geometry … but its really all about road safety

E N D
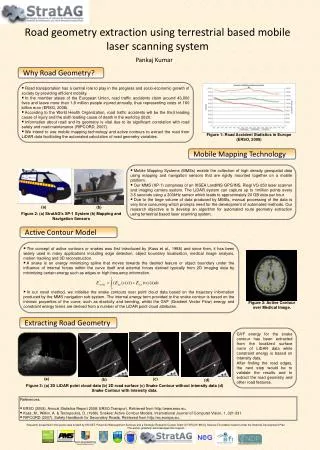
A network scan of horizontal road geometry Desmond O’Connor spatial data analyst
What is it about? • its about … • exploiting existing spatial data sources • utilise GPS data & patterns within the data • relating these patterns to road geometry • … but its really all about road safety • relating geometry to collision risk
The need to look for a different approach • collision risk based on historical collision data • retrospective approach • new EU directive (2008/96/EC) now S.I. No. 472 of 2011 • onroad infrastructure safety management • proactive approach “safety inspection” means an ordinary periodical verification of the characteristics and defects that require maintenance work for reasons of safety
Hazardous site identificationbackground issues Typical spatial distribution of all reported injury collisions DATACOLLECTION January IDENTIFICATION February March April DIAGNOSIS May June PRIORITYRANKING July August September IMPLEMENTATION October November EVALUATION December
One definition of a collision is … A collision is a rare, random, multi-factor event preceded by a situation in which one or more road users have failed to cope with their environment Road Safety Engineering in Ireland (1996)
Literature review • speed differentials can be used to assess road quality (route consistency) • In general the larger the difference in speed the greater the risk for a collision. • (design speed or posted speed –vs- actual speed) • Large speed differentials caused by ‘sharp bends’ Lamm et al. (1999) Hassen (2004) Watters & O’Mahony (2007) 62% of fatalities and 49% of other incidents occurring in curves, the first manoeuver that led to the accident was made at the beginning or the end of the curve PIARC (2003 ) road safety manual
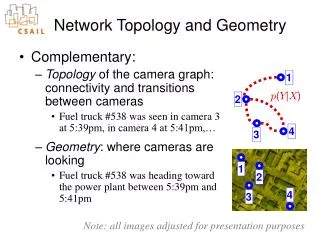
Speed differentials – A topology indicator GPS Satellites The observed difference in speed over distance tell us something about the vehicles velocity Sa speed at “a” Sa+v speed at a distance v from point a speed differential is described as … 5m Sd = Sa – Sa+v GPS Survey Classifying similar patterns of velocity along a route is a simple data mining technique to help describe horizontal road topology Road Condition Survey
Successful applications of data mining are not common, despite the vast literature now accumulating on the subject. The reason is that, although it is relatively straightforward to find a pattern or structure in data, establishing its relevance and explaining its cause are both very difficult problems Buttenfield et al (2001) Geospatial data mining and knowledge discovery
High Accident Locations Vol 1. The Principal Inter Urban Roads - April 1971 EuroRAP 2008: Ireland Results - Risk & Star rating of Irelands major roads – May 2008
Results of data mining Some of the 520,000 records of speed events for one direction Layer A Spatial Data Layers Within GIS Spatial point data, post classification into speed differentials (Sd) Sd = Sa – Sa+v Results of data mining - all point data showing a speed differential of excess of 10 kmph Layer B Point data transformed to linear data – 2,109 similar section identified Layer C
Reference populations: the results of data mining Direction of travel
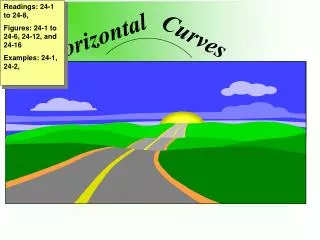
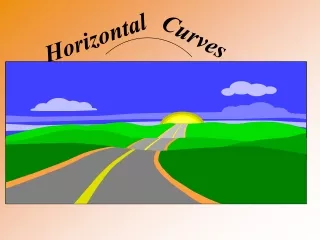
Sinuosity: another topology indicator The relative safety of a curve depends not only on its design speed but also on how it fits into its local speed environment. Charlton & de Pont (2007). Curve speed management Sinuosity values for road stretches of equal length increase with reducing aerial distance between their ends (A-AI, B-BI, C-CI) Image source d from Rautela & Pant (2007). - New methodology for demarcating high road accident risk-prone stretches in mountain roads
results input data
Results of sinuosity calculation and classification sections of low demand alignment high demand alignment
Reference populations – speed differential and sinuosity classification multiple bends within reference population single bend within reference population
Collision Rate = 11.58 per 108 vehicle km of travel Population A Length of roads with reference population = 1777 km Vehicle kilometres of travel = 8041569 km Sum of collisions used in collision rate calculation = 2380 (2001 to 2007) All rural sections including all bends reference population for all rural 2 lane NS roads Collision Rate = 14.03 per 108 vehicle km of travel Length of roads with reference population = 90 km Vehicle kilometres of travel = 319639 km Sum of collisions used in collision rate calculation = 127 (2001 to 2007) Multiple bends ≥ 10 km ph Population E reference population for multiple bend - rural sections Collision Rate = 17.23 per 108 vehicle km of travel Length of roads with reference population = 203 km Vehicle kilometres of travel = 821784 km Sum of collisions used in collision rate calculation = 362 (2001 to 2007) Single bend ≥ 10 km ph Population D reference population for all single bend – rural sections
Knowing where things are and why is essential to rational decision making Jack Dangermond president of ESRI from his welcome speech at the 1998 ESRI user conference in San Diego, I am deeply impressed by the fact that seemingly complex real world behaviour can arise naturally from simple, but iterative mathematics that needs no calculus, and is therefore easy to explain. Peter Burrough professor of physical Geography University of Utrecht, Netherlands comments contributed to Geographic Information Systems and Science by Longleyet al 2001
Conclusions • exploiting existing spatial data is a cost effextive and reliable way of scanning a road network for inconsistencies in horizontal geometry • Two topology indicators were identified allowing for a more proactive approach to collision analysis • Speed Differential • Sinuosity • This analysis has supported the decision to seek funding for road safety remedial works at 20 - 25 locations on national roads in 2011