Download
1 / 105
1.07k likes | 1.25k Views
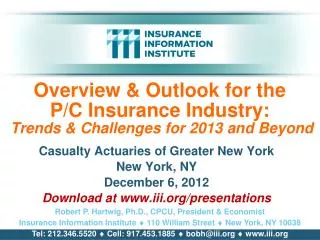
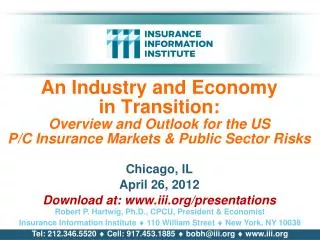
An Industry and Economy in Transition: Overview and Outlook for the US P/C Insurance Markets & Public Sector Risks. Chicago, IL April 26, 2012 Download at: www.iii.org/presentations. Robert P. Hartwig, Ph.D., CPCU, President & Economist

E N D
An Industry and Economyin Transition:Overview and Outlook for the US P/C Insurance Markets & Public Sector Risks Chicago, IL April 26, 2012 Download at: www.iii.org/presentations Robert P. Hartwig, Ph.D., CPCU, President & Economist Insurance Information Institute 110 William Street New York, NY 10038 Tel: 212.346.5520 Cell: 917.453.1885 bobh@iii.org www.iii.org
Economics 2012: The World Is Changing 2012 Is the First Year Since 2005 Where Economic Perceptions and Reality in the US Will Be Positive Enormous Consequences for Public Sector Risks 3
Economic Outlook for 2012 • Economic Growth Will Accelerate Modestly in 2012/13, Albeit Unevenly • No Double Dip Recession • Economy remains more resilient than most pundits presume • Consumer Confidence Will Continue to Improve • Consumer Spending/Investment Will Continue to Expand • Consumer and Business Lending Continue to Expand • Housing Market Remains Weak, but Some Improvement Expected by 2013 • Inflation Remains Tame • Runaway inflation highly unlikely but energy spike possible; Fed has things under control • Private Sector Hiring Remains Consistently Positive • Unemployment dips below 8% by year’s end • Sovereign Debt, Euro Currency/Economy, Muni Bond “Crises” Overblown • European Recession in Milder than Commonly Presumed • Soft Landing in China • Higher Oil Prices and Current Middle East Turmoil Pose Greater Risk to US Economy than in 2011 • Interest Rates Remain Low by Historical Standards; Edge Up by Year’s End • Stock and Bond Markets More Stable, Less Volatile • Political Environment Is More Hospitable to Business Interests • State Tax Receipts Rise, Local Revenues Lag Behind eSlide – P6466 – The Financial Crisis and the Future of the P/C
Implications for State/Municipal Finances and Public Entity Insurable Exposures • Overall State and Local Tax Receipts Are Rising • State tax receipts (as of Q4 2011) now exceed Q4 2007 peak • State PIT: +4.2%; Sales Tax: +2.4% (Q4 2011 vs. Q4 2010) • Local Tax Receipts Languish • Receipts up 0.6% in Q4 2011 vs. Q4 2010 but down in real terms for 5 quarters • Local Tax Receipts Are Exceedingly Dependent on Property Taxes • Over the past two decades, property tax share of revenues has exceeded 2/3 of total • As of Q4 2011, that share is 85.1 • Cities/counties exposed to falling property values, downward reassessments for years • Stimulus money is effectively exhausted • Muni Bond Market Never Crashed • State/Local issuers can still borrower at favorable rates • State/Local Governments Are Spending More • Expenditures were up an estimated 2.2% in 2011, the second consecutive year of increase • State/Local Spending Will Generate Little Additional Insurance Exposure • Public construction activity continues to shrink even as growth returns to private sector • Massive State/Local Pension Obligations Will Temper Govt. Investment • Impact will be on public “investment” that generates insurance exposures • Rehiring of teachers, fire, police, etc., may also receive higher priority eSlide – P6466 – The Financial Crisis and the Future of the P/C
The Strength of the Economy Will Influence P/C Insurer Growth Opportunities Growth Will Expand Insurable Exposures and Help Absorb Excess Capital 7
US Real GDP Growth* The Q4:2008 decline was the steepest since the Q1:1982 drop of 6.8% Real GDP Growth (%) Recession began in Dec. 2007. Economic toll of credit crunch, housing slump, labor market contraction has been severe but modest recovery is underway 2012 is expected to see a modest but choppy acceleration in growth continuing into 2013 Demand for Insurance Continues To Be Impacted by Sluggish Economic Conditions, but the Benefits of Even Slow Growth Will Compound and Gradually Benefit the Economy Broadly * Estimates/Forecasts from Blue Chip Economic Indicators. Source: US Department of Commerce, Blue Economic Indicators 4/12; Insurance Information Institute.
Consumer Sentiment Survey (1966 = 100) January 2010 through March 2012 Optimism among consumers is recovering, in part due to an improving jobs outlook, after plunging amid the debt debate debacle and S&P downgrade Consumer confidence has been low for years amid high unemployment, falling home prices and other factors adversely impact consumers, but improved substantially in late 2011 and early 2012 Source: University of Michigan; Insurance Information Institute
Auto/Light Truck Sales, 1999-2022F New auto/light truck sales fell to the lowest level since the late 1960s. Forecast for 2012-13 is still far below 1999-2007 average of 17 million units, but a recovery is underway. (Millions of Units) Job growth and improved credit market conditions will boost auto sales in 2012 and beyond Car/Light Truck Sales Will Continue to Recover from the 2009 Low Point, Bolstering the Auto Insurer Growth and the Manufacturing Sector. Source: U.S. Department of Commerce; Blue Chip Economic Indicators (10/11 and 4/12); Insurance Information Institute.
New Private Housing Starts, 1990-2022F New home starts plunged 72% from 2005-2009; A net annual decline of 1.49 million units, lowest since records began in 1959 (Millions of Units) Job growth, improved credit market conditions and demographics will eventually boost home construction The plunge and lack of recovery in homebuilding and in construction in general is holding back payroll exposure growth Little Exposure Growth Likely for Homeowners Insurers Until at least 2014. Also Affects Commercial Insurers with Construction Risk Exposure, Surety Source: U.S. Department of Commerce; Blue Chip Economic Indicators (10/11 and 4/12); Insurance Information Institute.
Value of Construction Put in Place, Feb. 2012 vs. Feb. 2011* Growth (%) Private: +10.2% Public: -1.4% Private sector construction activity is up in both the residential and nonresidential segments Public sector construction activity remains depressed Overall Construction Activity is Up, But Growth Is Entirely in the Private Sector as State/Local Government Budget Woes Continue *seasonally adjustedSource: U.S. Census Bureau, http://www.census.gov/construction/c30/c30index.html ; Insurance Information Institute.
Value of Private Construction Put in Place, by Segment, Feb. 2012 vs. Feb. 2011* Growth (%) Private sector construction activity is up by double digits in many segments after plunging during the “Great Recession” Private Construction Activity is Up in Most Segments, Including Residential Construction *seasonally adjustedSource: U.S. Census Bureau, http://www.census.gov/construction/c30/c30index.html ; Insurance Information Institute.
Value of Public Construction Put in Place, by Segment, Feb. 2012 vs. Feb. 2011* Public sector construction activity is down by double digits in many segments Growth (%) Public Construction Activity is Up Down in Many Segments as State, City and County Budgets Remain Under Stress *seasonally adjustedSource: U.S. Census Bureau, http://www.census.gov/construction/c30/c30index.html ; Insurance Information Institute.
ISM Manufacturing Index (Values > 50 Indicate Expansion) January 2010 through March 2012 Optimism among manufacturers was increasing in late 2011 and into early 2012 The manufacturing sector has been expanding and adding jobs. The question is whether this will continue. Source: Institute for Supply Management at http://www.ism.ws/ismreport/mfgrob.cfm; Insurance Information Institute.
Dollar Value* of Manufacturers’ Shipments Monthly, Jan. 1992—Feb. 2012 $ Millions The value of Manufacturing Shipments in Feb. 2012 was up 30% to $462B from its May 2009 trough. Dec. figure is only 4.7% below its previous record high in July 2008. Monthly shipments are nearly back to peak (in July 2008, 8 months into the recession). Trough in May 2009. Growth from trough to February 2012 was 30%. This growth leads to gains in many commercial exposures: WC, Commercial Auto, Property and Various Liability Coverages *seasonally adjustedSource: U.S. Census Bureau, Full Report on Manufacturers’ Shipments, Inventories, and Orders, http://www.census.gov/manufacturing/m3/ 17 12/01/09 - 9pm eSlide – P6466 – The Financial Crisis and the Future of the P/C
Recovery in Capacity Utilization is a Positive Sign for Commercial Exposures March 2001 through March 2012 “Full Capacity” The US operated at 78.6% of industrial capacity in Mar. 2012, above the June 2009 low of 68.3% and close to its post-crisis peak Percent of Industrial Capacity Hurricane Katrina The closer the economy is to operating at “full capacity,” the greater the inflationary pressure March 2001-November 2001 recession December 2007-June 2009 Recession 19 Source: Federal Reserve Board statistical releases at http://www.federalreserve.gov/releases/g17/Current/default.htm.
ISM Non-Manufacturing Index (Values > 50 Indicate Expansion) January 2010 through March 2012 Optimism among non-manufacturers was stable in late 2011 and increased in early 2012 Non-manufacturing industries have been expanding and adding jobs. The question is whether this will continue. Source: Institute for Supply Management at http://www.ism.ws/ismreport/nonmfgrob.cfm; Insurance Information Institute.
Business Bankruptcy Filings,1980-2011 % Change Surrounding Recessions 1980-82 58.6% 1980-87 88.7% 1990-91 10.3% 2000-01 13.0% 2006-09 208.9%* 2011 bankruptcies totaled 47,806, down 15.1% from 56,282 in 2010—the second consecutive year of decline. Business bankruptcies more than tripled during the financial crisis. Significant Exposure Implications for All Commercial Lines as Business Bankruptcies Begin to Decline Sources: American Bankruptcy Institute at http://www.abiworld.org/AM/AMTemplate.cfm?Section=Home&TEMPLATE=/CM/ContentDisplay.cfm&CONTENTID=61633; Insurance Information Institute 21 12/01/09 - 9pm eSlide – P6466 – The Financial Crisis and the Future of the P/C
Private Sector Business Starts, 1993:Q2 – 2011:Q2* Business Starts2006: 872,0002007: 843,0002008: 790,0002009: 697,000 2010: 722,0002011: 740,000** (Thousands) Business starts were up 4.5% to 370,000 in the first half of 2011 vs. first half 2011. 722,000 new business starts were recorded in 2010, up 3.6% from 697,000 in 2009, which was the slowest year for new business starts since 1993 Business Starts Were Down Nearly 20% in the Recession, Holding Back Most Types of Commercial Insurance Exposure, But Are Recovering Slowly * Data through June 30, 2011 are the latest available as of March 7, 2012; Seasonally adjusted. Source: Bureau of Labor Statistics, http://www.bls.gov/news.release/cewbd.t08.htm. 22 12/01/09 - 9pm eSlide – P6466 – The Financial Crisis and the Future of the P/C
12 Industries for the Next 10 Years: Insurance Solutions Needed Health Care Health Sciences Energy (Traditional) Many industries are poised for growth, though insurers’ ability to capitalize on these industries varies widely Alternative Energy Petrochemical Agriculture Natural Resources Technology (incl. Biotechnology) Light Manufacturing Insourced Manufacturing Export-Oriented Industries Shipping (Rail, Marine, Trucking)
State & Local Government Finances Are Recovering State Finances Are Improving as Local Governments Continue to Face Challenges 24
Local Tax Revenues Languish While State Receipts Recover Year-Over-Year Change in Inflation-Adjusted State and Local Taxes % Change of 4-Quarter Average, 2004-2011 State tax receipts plunged during the “Great Recession” due to a greater dependence on income taxes but are recovering with as the job market growth improves Local tax receipts are more stable due to a a greater dependence on property tax receipts, but falling assessments are hurting revenues Sources: US Census Bureau (tax revenues); BEA; Nelson A. Rockefeller Institute of Government: http://www.rockinst.org/; Insurance Information Institute. eSlide – P6466 – The Financial Crisis and the Future of the P/C
Income and Sales Tax Revenues Recover While Property Taxes Decline Year-Over-Year Change in Inflation-Adjusted State and Local Taxes % Change of 4-Quarter Average, 2004-2011 Income and sales tax receipts are growing again Property tax continue to decline. In Q4 2011 this tax source accounted for 85.1% of all local tax receipts Sources: US Census Bureau (tax revenues); BEA; Nelson A. Rockefeller Institute of Government: http://www.rockinst.org/; Insurance Information Institute. eSlide – P6466 – The Financial Crisis and the Future of the P/C
State and Local Government Expenditures and Net Investment, 2000-2011E (Billions of Dollars) Fiscal crises in many states, counties and cities dramatically slowed the pace of increase in in government spending State and local governments face flat tax revenues and increased demand for government services and huge pressure from public worker pension obligations. These pressures are keeping a lid on spending on infrastructure and other projects that would generate insurance exposure. Source: Bureau of Economic Analysis; Insurance Information Institute (2011 estimate). 27 12/01/09 - 9pm eSlide – P6466 – The Financial Crisis and the Future of the P/C
Year-Over-Year Change in Quarterly USState Tax Revenues, Inflation Adjusted Nationwide, state-tax collections for fiscal year 2011 increased by the largest amount since 2005 States Revenues Were Up 1.5% in Q4 2011, the 8th Consecutive Quarter of Revenue Increase. Impact on Public Infrastructure Spending is Unclear as State/Local Governments Grapple with Pension Shortfalls Source: US Census Bureau; Nelson A. Rockefeller Institute of Government: http://www.rockinst.org/. eSlide – P6466 – The Financial Crisis and the Future of the P/C
States with the Fastest Increase in Tax Revenues Period Ending Oct. – Dec. 2011 vs. Oct. – Dec. 2010 (%) Some States Are Doing Much Better Than Others Source: US Census Bureau; Nelson A. Rockefeller Institute of Govt.; Insurance Information Institute. eSlide – P6466 – The Financial Crisis and the Future of the P/C
States with the Slowest Growth in Tax Revenues Period Ending Oct. – Dec. 2011 vs. Oct. – Dec. 2010 (%) State Tax Receipts in These States Were Well Below the 3.6% Increase Across All States Some States Are Still Seeing Negative or Negligible Growth in State Tax Revenues Source: US Census Bureau; Nelson A. Rockefeller Institute of Govt.; Insurance Information Institute. eSlide – P6466 – The Financial Crisis and the Future of the P/C
Labor Market Trends Massive Job Losses Sapped the Economy and Commercial/Personal Lines Exposure, But Trend is Improving 31
Unemployment and Underemployment Rates: Stubbornly High in 2012, But Falling January 2000 through March 2012, Seasonally Adjusted (%) U-6 went from 8.0% in March 2007 to 17.5% in October 2009; Stood at 14.5% in Mar. 2012 Recession ended in November 2001 Unemployment kept rising for 19 more months Recession began in December 2007 Unemployment stood at 8.2% in March 2012 Unemployment peaked at 10.1% in October 2009, highest monthly rate since 1983. Peak rate in the last 30 years: 10.8% in November - December 1982 Feb 12 Stubbornly high unemployment and underemployment constrain overall economic growth, but the job market is now clearly improving Source: US Bureau of Labor Statistics; Insurance Information Institute. 32 12/01/09 - 9pm eSlide – P6466 – The Financial Crisis and the Future of the P/C
Monthly Change in Private Employment January 2008 through March 2012* (Thousands) 121,000 private sector jobs were created in March Monthly Losses in Dec. 08–Mar. 09 Were the Largest in the Post-WW II Period Private Employers Added 4.159 million Jobs Since Jan. 2010 After Having Shed 4.66 Million Jobs in 2009 and 3.81 Million in 2008 (State and Local Governments Have Shed Hundreds of Thousands of Jobs Source: US Bureau of Labor Statistics: http://www.bls.gov/ces/home.htm; Insurance Information Institute
Cumulative Change in Private Employment: Dec. 2007—Mar. 2012 December 2007 through March 2012* (Millions) Cumulative job losses peaked at 8.444 million in December 2009 Cumulative job losses as of Mar. 2012 totaled 4.285 million All of the jobs “lost” since President Obama took office in Jan. 2009 have been recouped Private Employers Added 4.159 million Jobs Since Jan. 2010 After Having Shed 4.66 Million Jobs in 2009 and 3.81 Million in 2008 (State and Local Governments Have Shed Hundreds of Thousands of Jobs) Source: US Bureau of Labor Statistics: http://www.bls.gov/ces/home.htm; Insurance Information Institute
Unemployment Rates by State, March 2012:Highest 25 States* In March, 30 states reported over-the-month unemployment rate decreases, 8 had increases, and 12 and the District of Columbia had no change. *Provisional figures for March 2012, seasonally adjusted. Sources: US Bureau of Labor Statistics; Insurance Information Institute.
Unemployment Rates By State, March 2012: Lowest 25 States* In March, 30 states reported over-the-month unemployment rate decreases, 8 had increases, and 12 and the District of Columbia had no change. *Provisional figures for March 2012, seasonally adjusted. Sources: US Bureau of Labor Statistics; Insurance Information Institute.
US Unemployment Rate Jobless figures have been revised downwards for 2012 2007:Q1 to 2013:Q4F* Rising unemployment eroded payrolls and workers comp’s exposure base. Unemployment peaked at 10% in late 2009. Unemployment forecasts have been revised downwards for 2012 and 2013. Optimistic scenarios put the unemployment as low as 7.7% by Q4 of this year. * = actual; = forecasts Sources: US Bureau of Labor Statistics; Blue Chip Economic Indicators (4/12 edition); Insurance Information Institute.
US Unemployment Rate Forecasts Quarterly, 2012:Q2 to 2013:Q4 Unemployment will remain high even under the most optimistic of scenarios, but forecasts are being revised downwards Steadily Decreasing Unemployment Should Benefit theWorkers Comp Exposure Base at Least Through 2013 Sources: Blue Chip Economic Indicators (4/12); Insurance Information Institute eSlide – P6466 – The Financial Crisis and the Future of the P/C
Nonfarm Payroll (Wages and Salaries):Quarterly, 2005–2011:Q4 Billions Latest (2011:Q4) was $6.71 trillion, a new peak Peak was 2008:Q1 at $6.60 trillion Pace of payroll growth is accelerating Growth rates in 2011Q2 over Q1: 0.6%Q3 over Q2: 0.4% Q4 over Q3: 1.0% Recent trough (2009:Q3) was $6.25 trillion, down 5.3% from prior peak Note: Recession indicated by gray shaded column. Data are seasonally adjusted annual rates. Sources: http://research.stlouisfed.org/fred2/series/WASCUR; National Bureau of Economic Research (recession dates); Insurance Information Institute. 39 12/01/09 - 9pm eSlide – P6466 – The Financial Crisis and the Future of the P/C
P/C Insurance Industry Financial Overview Profit Recovery Was Set Back in 2011 by High Catastrophe Loss & Other Factors 40
P/C Net Income After Taxes1991–2011 ($ Millions) P-C Industry 2011 profits were down 46% to $19.2B vs. 2010, due primarily to high catastrophe losses and as non-cat underwriting results deteriorated • 2005 ROE*= 9.6% • 2006 ROE = 12.7% • 2007 ROE = 10.9% • 2008 ROE = 0.1% • 2009 ROE = 5.0% • 2010 ROE = 6.6% • 2011:Q3 ROAS1 = 3.5% * ROE figures are GAAP; 1Return on avg. surplus. Excluding Mortgage & Financial Guaranty insurers yields a 4.6% ROAS for 2011, 7.6% for 2010 and 7.4% for 2009. Sources: A.M. Best, ISO, Insurance Information Institute
A 100 Combined Ratio Isn’t What ItOnce Was: Investment Impact on ROEs A combined ratio of about 100 generated ~5.5% ROE in 2009/10,10% in 2005 and 16% in 1979 Combined Ratio / ROE Combined Ratios Must Be Lower in Today’s DepressedInvestment Environment to Generate Risk Appropriate ROEs * 2008 -2011 figures are return on average surplus and exclude mortgage and financial guaranty insurers. 2011 combined ratio including M&FG insurers is 108.2, ROAS = 3.5%. Source: Insurance Information Institute from A.M. Best and ISO data.
Profitability Peaks & Troughs in the P/C Insurance Industry, 1975 – 2011* History suggests next ROE peak will be in 2016-2017 ROE 1977:19.0% 1987:17.3% 2006:12.7% 10 Years 1997:11.6% 2011:4.6%* 10 Years 9 Years 1975: 2.4% 2001: -1.2% 1992: 4.5% 1984: 1.8% *Profitability = P/C insurer ROEs are I.I.I. estimates. 2011 figure is an estimate based on ROAS data. Note: Data for 2008-2011 exclude mortgage and financial guaranty insurers. For 2011:Q3 ROAS = 3.5% including M&FG. Source: Insurance Information Institute; NAIC, ISO, A.M. Best.
Global Catastrophe Loss Developments and Trends 2011 Rewrote Catastrophe Loss and Insurance History But Will Losses Turn the Market? 47
Natural Loss Events, 2011World Map Flash floods, floods Italy, France, Spain 4–9 Nov. Winter Storm Joachim France, Switzerland, Germany, 15–17 Dec. Wildfires Canada, 14–22 May Earthquake Turkey 23 Oct. Severe storms, tornadoes USA, 20–27 May Hurricane Irene USA, Caribbean 22 Aug.–2 Sept. Earthquake, tsunami Japan, 11 March Floods USA, April–May Drought USA, Oct. 2010–ongoing Severe storms, tornadoes USA, 22–28 April Tropical Storm Washi Philippines, 16–18 Dec. Wildfires USA, April/Sept. Floods Pakistan Aug.–Sept. Cyclone Yasi Australia, 2–7 Feb. Floods Thailand Aug.–Nov. Floods, landslides Guatemala, El Salvador 11–19 Oct. Floods, flash floods Australia, Dec. 2010–Jan. 2011 Landslides, flash floods Brazil, 12/16 Jan. Earthquake New Zealand, 22 Feb. Drought SomaliaOct. 2010–Sept. 2011 Number of Events: 820 Earthquake New Zealand, 13 June Natural catastrophes Geophysical events(earthquake, tsunami, volcanic activity) Hydrological events(flood, mass movement) Selection of significant loss events (see table) Meteorological events (storm) Climatological events(extreme temperature, drought, wildfire) 49 Source: MR NatCatSERVICE
Top 16 Most Costly World Insurance Losses, 1970-2011** 5 of the top 14 most expensive catastrophes in world history have occurred within the past 2 years (Insured Losses, 2011 Dollars, $ Billions) Taken as a single event, the Spring 2011 tornado and thunderstorm season would likely become the 5thcostliest event in global insurance history *Average of range estimates of $35B - $40B as of 1/4/12; Privately insured losses only. **Figures do not include federally insured flood losses. Sources: Swiss Re sigma 1/2011; Munich Re; Insurance Information Institute research.
U.S. Insured Catastrophe Loss Update 2011 Was One of the Most Expensive Years on Record 58
Top 14 Most Costly Disastersin U.S. History (Insured Losses, 2011 Dollars, $ Billions) Taken as a single event, the Spring 2011 tornado and storm season are is the 4thcostliest event in US insurance history Hurricane Irene became the 11th most expense hurricane in US history *Losses will actually be broken down into several “events” as determined by PCS. Includes losses for the period April 1 – June 30. Sources: PCS; Insurance Information Institute inflation adjustments.
Natural Disasters in the United States, 1980 – 2011Number of Events (Annual Totals 1980 – 2011) There were 117 natural disaster events in 2011 Number 37 8 51 2 Meteorological (storm) Climatological (temperature extremes, drought, wildfire) Geophysical (earthquake, tsunami, volcanic activity) Hydrological (flood, mass movement) Source: MR NatCatSERVICE 60
US Insured Catastrophe Losses $100 Billion CAT Year is Coming Eventually ($ Billions, 2011 Dollars) Record Tornado Losses Caused 2011 CAT Losses to Surge US CAT Losses in 2011 Were the 5th Highest in US History on An Inflation Adjusted Basis *PCS figure as of April 6, 2012. Note: 2001 figure includes $20.3B for 9/11 losses reported through 12/31/01 ($25.9B 2011 dollars). Includes only business and personal property claims, business interruption and auto claims. Non-prop/BI losses = $12.2B ($15.6B in 2011 dollars.) Sources: Property Claims Service/ISO; Insurance Information Institute. 62 12/01/09 - 9pm eSlide – P6466 – The Financial Crisis and the Future of the P/C
2011’s Most Expensive Catastrophes, Insured Losses Includes $1.65B in AL, mostly in the Tuscaloosa and Birmingham areas Includes approximately $2B in losses for May 22 Joplin tornado **Includes $700 million in flood losses insured through the National Flood Insurance Program. Source: PCS except as noted by “*” which are sourced to Munich Re; Insurance Information Institute.
Combined Ratio Points Associated with Catastrophe Losses: 1960 – 2011* Avg. CAT Loss Component of theCombined Ratio by Decade 1960s: 1.04 1970s: 0.85 1980s: 1.31 1990s: 3.39 2000s: 3.52 2010s: 6.70* Combined Ratio Points The Catastrophe Loss Component of Private Insurer Losses Has Increased Sharply in Recent Decades *Insurance Information Institute estimates for 2010 and 2011 based on A.M. Best data. Notes: Private carrier losses only. Excludes loss adjustment expenses and reinsurance reinstatement premiums. Figures are adjusted for losses ultimately paid by foreign insurers and reinsurers. Source: ISO; Insurance Information Institute.
U.S. Thunderstorm Loss Trends, 1980 – 2011 Thunderstorm losses in 2011 totaled a record $25.8 billion Hurricanes get all the headlines, but thunderstorms are consistent producers of large scale loss. 2008-2011 are the most expensive years on record. Average thunderstorm losses are up more than 5 fold since the early 1980s Source: Property Claims Service, MR NatCatSERVICE 66
U.S. Winter Storm Loss Trends, 1980 – 2011 Insured winter storm losses in 2011 totaled $2.0 billion. Average winter storm losses have nearly doubled since the early 1980s Source: Property Claims Service, MR NatCatSERVICE 67