Download
1 / 37
370 likes | 502 Views
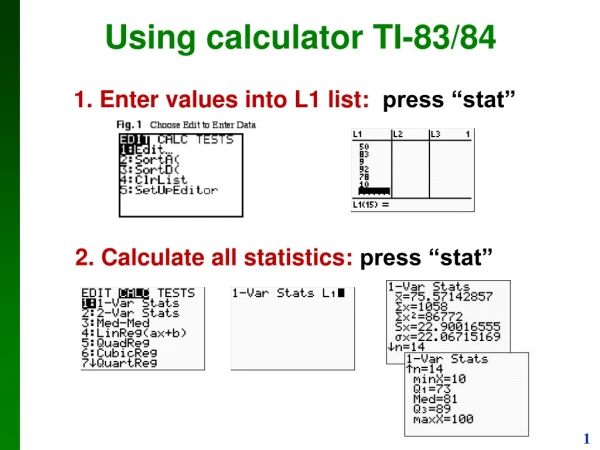
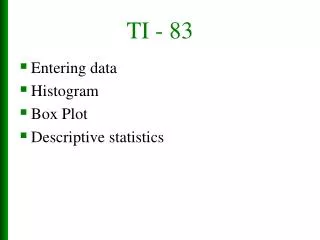
This guide explores the importance of data visualization in descriptive statistics, focusing on two key graphical representations: histograms and box plots. It discusses how to effectively enter data and interpret these visual tools to summarize data distributions, identify outliers, and observe data trends. Through clear examples and practical advice, readers will learn how to enhance their data analysis skills and communicate findings effectively using these visual aids.

E N D