Download
1 / 17
170 likes | 569 Views
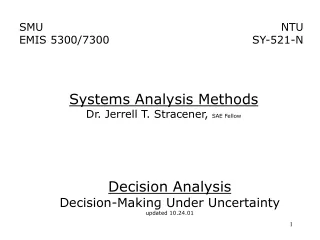
SMU EMIS 5300/7300. Systems Analysis Methods. Decision Analysis: Decision-Making Under Risk updated 2 December 2005. Decision Table State of the Economy Stagnant Slow Rapid Growth Growth Maximum Stocks -$500 $700 $2200 $2200

E N D
SMU EMIS 5300/7300 Systems Analysis Methods Decision Analysis: Decision-Making Under Risk updated 2 December 2005
Decision Table State of the Economy Stagnant Slow Rapid Growth Growth Maximum Stocks -$500 $700 $2200 $2200 Investment Bonds -$100 $600 $900 $900 Decision Alternative CD’s $300 $500 $750 $750 Mixture-$200 $650 $1300 $1300
Equally Likely (Laplace) Criterion • Assumes all states of nature are equally likely • Selects the alternative with the maximum average payoff • Selects Stocks in our example
Decision-Making Under Risk • States of nature are not equally likely, but will occur with know probabilities • The payoff for each alternative is a random variable • Decision-making criteria consider the expected payoff of each alternative
Investment Example • Suppose that P(stagnant economy) = 0.5, P(slow growth) = 0.3, and P(rapid growth) = 0.2 • In this case, the payoff for each alternative, stocks, bonds, cd’s, or mixture, is a random variable. • One decision criterion is to pick the alternative that gives the maximum expected monetary value (EMV).
Probability Mass Function of Payoff from Stocks • Let X be the payoff from investing in stocks • The probability mass function of X is • Expected value of X
Expected Monetary Value Criterion • Selects the alternative with the maximum expected (mean) monetary value (payoff) CD’s give the maximum EMV.
The Expected Value with Perfect Information • Suppose that before we invest, we can consult an oracle who knows with certainty which state of nature will occur. Our investment policy is: • If the oracle says that the economy will be stagnant, invest in CD’s and receive a payoff of 300, else • if the oracle says that economy will grow slowly, invest in stocks and receive a payoff of 700, else • if the oracle says that economy will grow rapidly, invest in stocks and receive a payoff of 2,200.
The Expected Value with Perfect Information • The outcome of this experiment is also a random variable, • The expected value of this random variable is called the expected value with perfect information (EVwPI).
The Expected Value of Perfect Information • The advantage gained by perfect information, EVwPI – Max EMV, is known as the expected value of perfect information (EVPI). • In this case EVPI = $800 – $450 = $350.
The Expected Opportunity Loss Criteria • An alternative to maximizing the expected payoff is to minimize the expected opportunity loss (EOL). That is, minimize the expected regret.
Opportunity Loss Table State of the Economy Stagnant Slow Rapid Growth Growth Stocks $800 $0 $0 Investment Bonds $400 $100 $1300 Decision Alternative CD’s $0 $200 $1450 Mixture$500 $50 $900
Expected Opportunity Loss (EOL) CD’s minimize EOL.
Sensitivity Analysis Example CD’s give the maximum EMV. Let p be the probability of slow growth. How does our decision change as a function of p?
Sensitivity Analysis Example EMV (Stocks) = $700 p + (- $500)(1- p) = $1,200 p - $500 EMV(Bonds) = $600 p + (-$100)(1- p) = $700 p - $100 EMV(CD’s) = $500 p + $300(1- p) = $200 p + $300 EMV(Mixture) = $650 p + (-$200)(1- p) = $850 p - $200
EMV as a Function of p Switch from CD’s to Mixture for some P in (0.7,0.8). Switch from Mixture to Stocks for some P in (0.8,0.9).
Sensitivity Analysis Example For which value of P are we indifferent between CD’s and Mixture? EMV(CD’s) = $500 p + $300(1- p) = $200 p + $300 EMV(Mixture) = $650 p + (-$200)(1- p) = $850 p - $200 $200 p + $300 = $850 p - $200 => $500 = $650 p => p = 0.78. For which value of P are we indifferent between Stocks and Mixture? EMV (Stocks) = $700 p + (- $500)(1- p) = $1,200 p - $500 $1,200 p - $500 = $850 p - $200 => $350 p = $300 => p = 0.86