Using Concept Maps in Planning an Introductory Statistics Course.
340 likes | 817 Views
Using Concept Maps in Planning an Introductory Statistics Course. Roger Woodard. Missing the big picture. Most students in introductory statistics courses See statistics as disconnected topics Learn normal distribution for first exam Then forget it Learn confidence intervals for second exam

Using Concept Maps in Planning an Introductory Statistics Course.
E N D
Presentation Transcript
Using Concept Maps in Planning an Introductory Statistics Course. Roger Woodard
Missing the big picture • Most students in introductory statistics courses • See statistics as disconnected topics • Learn normal distribution for first exam • Then forget it • Learn confidence intervals for second exam • Then forget it
Missing the big picture • Never see connection • Some don’t associate 1.96 in margin of error with normal distribution • Bigger problem: Don’t understand where confidence intervals will be in their lives. • Why do I care?
Problem • Need to convey to students the interconnections of statistical topics • Need to convey to students an overall goal that motivates what topics will be covered.
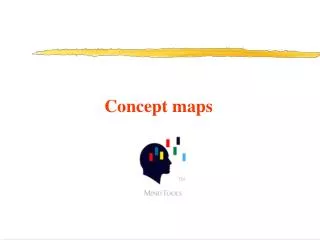
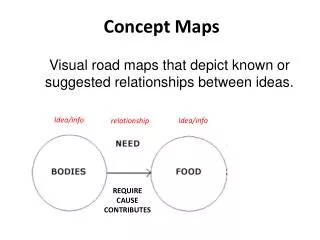
Possible Solution • Concept maps • Graphical organizer that shows topics • Presents course concepts and associated links
Topics covered Sample Surveys Errors in surveys Experiments and design Question Wording Histograms Mean median mode Standard Deviation Normal Distributions Sampling Distributions Basic probability Confidence Intervals C.I. for a mean Hypothesis tests Chi Square tests Regression Correlation Two way tables Example: ST101
What links them? • Course Goal • Often not made explicit to students • Listed in syllabus and then forgotten
Example: ST101 • Course Goal • ST101 is for non-scientific majors • Will not often use statistics in their fields • Understand Statistics Presented in the Popular Press. • What is in the press? • Surveys: Bush and Kerry tied for presidency. • Scientific Studies: Grapefruit Fights Cancer
Example: ST101 • How often do we see the normal distribution in Cosmo or USA Today? • Rarely • Why do students need to know about Normal distribution?
Course Goal: Understand Statistical Inference presented in the media. Most often includes Also Includes Sample Surveys Scientific Studies
Course Goal: Understand Statistical Inference presented in the media. Most often includes Also Includes Sample Surveys Scientific Studies Tell about Rules out chance in Margin of Error Statistical Significance
Course Goal: Understand Statistical Inference presented in the media. Course Goal: Understand Statistical Inference presented in the media. Most often includes Most often includes Also Includes Also Includes Sample Surveys Sample Surveys Scientific Studies Scientific Studies Non-random samples Random samples Randomized Experiments Non-random experiments Tell about Tell about Rules out chance in Rules out chance in Margin of Error Margin of Error Statistical Significance Statistical Significance
Where are the other topics? • How do histograms, standard deviations and the normal distribution fit in?
Course Goal: Understand Statistical Inference presented in the media. Course Goal: Understand Statistical Inference presented in the media. Most often includes Most often includes Also Includes Also Includes Sometimes includes Data Presentation and Summary Sample Surveys Sample Surveys Scientific Studies Scientific Studies Includes Non-random samples Random samples Randomized Experiments Non-random experiments Means, Histograms, etc. Tell about Tell about Rules out chance in Rules out chance in Margin of Error Margin of Error Statistical Significance Statistical Significance
Course Goal: Understand Statistical Inference presented in the media. Course Goal: Understand Statistical Inference presented in the media. Most often includes Most often includes Also Includes Also Includes Sometimes includes Data Presentation and Summary Sample Surveys Sample Surveys Scientific Studies Scientific Studies Includes Non-random samples Non-random samples Random samples Random samples Randomized Experiments Randomized Experiments Non-random experiments Non-random experiments Means, Histograms, etc. Are used to picture Distributions of Data Tell about Tell about Rules out chance in Rules out chance in A special case is Normal Distribution Margin of Error Margin of Error Statistical Significance Statistical Significance
Need connections • What connects these tools with “important things”? • What are the links that make all of these part of statistics?
Concept Map • Identifies Sampling distributions as the link that holds everything together. • Throughout the course I stress this link. • When talking about normal distribution foreshadow distribution of statistic. • When working with p-values I bring them back. • Identifies dead ends
Characteristics of Concept Maps • Consist of propositions • Key concepts together with linking phrases • In concise language • Show hierarchy • What topics are subtopics • Shown graphically
Advantages for Course Planning • Help instructor visualize concepts • What do you want to focus on? • What topics should you foreshadow? • Which topics are superfluous? • Can be presented to students when finished. • Help them see the interrelationships • Emphasize key ideas
Advantages for Course Planning • Allow to think about order • What is needed to support an idea? • Can’t do Normal Distribution before standard deviation. • Doesn’t dictate order
Not Just a Course Outline • Syllabus/Course outline is linear • Can’t show cross links. • Can’t show supporting concepts. • Syllabus/Course is not as concise • Typically more verbose • Course outline still needed. • Lists time order of the topics.
Creating a Concept Map • Identify course goal (or goals) • Guided by course description or guidelines from course and curriculum committee. • Identify 4 to 7 key topics that are needed to achieve this goal. • Research shows that is max we can understand. • Pick big ones
Creating a Concept Map • Identify linking phrases that connect concepts to the goal and to each other • Add sub topics and relation topics as needed. • Determine which topic is the focal point for the course, and how it relates to the course goal. • Create graphic map with connections
Creating a Concept Map • Revise the map • Discuss with other instructors • Think about implications for teaching • Think about personal philosophy • Convey your understanding • Use it. • Emphasize key concepts and course goal. • Encourage students to use it.
Advantages of Concept maps • Visualize concepts • Most students are visual learners • More readily understand graphical presentation • Connections are Explicit • Not a disconnected list of topics.
Cautions • Creation is not easy • Requires substantial though • Can be done in stages • Don’t try to fit in everything • Concentrate on the key topics • Not everyone has the same map • Even for the same course.
Other Uses and Ideas • Concept maps for assessment • Fill in the blanks • Draw from scratch • Use to arrange materials in online course. • Extensive hyperlinks
Other Uses and Ideas • Hyperlinked on the web • Linked to learning objectives • Notes or presentations • Study guides • Images or Video
Further Development • Examine use of concept maps in TA training. • Do they teach better? More consistently? • Provide resources for instructors to build concept maps • CAUSEweb.org • US COTS • Put together concept maps for major textbooks • Working with text authors