Download
1 / 1
10 likes | 137 Views
ESRI shapefile. Avenue script. upload. XML format. PHP script. Database. generate. S3 server. SVG sniplet. PHP / java script. SVG. assemble. Web mapping services for biological data S VG S niplet S erver. Francisco Hernandez, Bart Vanhoorne, Roeland T’Jampens, Edward Vanden Berghe.

E N D
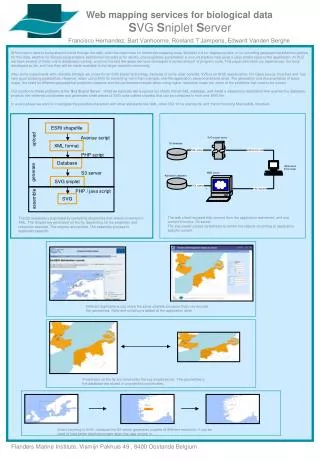
ESRI shapefile Avenue script upload XML format PHP script Database generate S3 server SVG sniplet PHP / java script SVG assemble Web mapping services for biological data SVG Sniplet Server Francisco Hernandez, Bart Vanhoorne, Roeland T’Jampens, Edward Vanden Berghe When marine data is being shared online through the web, often the need rises for interactive mapping tools. Whether it is for displaying data, or for providing geographical selection options for this data, whether for biological parameters (distribution records) or for abiotic, oceanographic parameters: a nice, interactive map gives a clear added value to the application. At VLIZ we have several of these online databases running, and over the last few years we have developed a certain amount of program code. This paper describes our experiences, the tools developed so far, and how they will be made available to the larger scientific community. After some experiments with clickable bitmaps we chose for an SVG based technology, because of some clear benefits: SVG is an W3C specification, it is Open source, thus free and has very good scripting possibilities. However, when using SVG for something more than a simple, one-file-application, several problems arise. The generation and documentation of base maps, the need for different geographical projection systems and the performance issues when using higher resolution maps are some of the problems that need to be solved. Our solution to these problems is the ‘Svg Sniplet Server’. What we basically did is upload our charts into an SQL database, and install a webservice application that queries the database, projects the retrieved coordinates and generates small pieces of SVG code (called sniplets) that can be combined to form one SVG file. In a next phase we want to investigate the possible interaction with other standards like GML, other ISO 191xx standards, and the forthcoming MarineXML standard. The web client requests http content from the application webserver, and svg content from the S3 server. The svg viewer parses stylesheets to render the objects according to application specific content. The S3 database is populated by uploading shaprefiles that where converted to XML. The Sniplet are generated on the fly, depending on the projection and resolution required. The sniplets are cached. The assembly process is application specific. Different applications can share the same sniplets, because they only encode the geometries. Style and scripting is added at the application level. Projections on the fly are handled by the svg sniplet server. The geometries in the database are stored in unprojected coordinates. Smart zooming in SVG : because the S3 server generates sniplets of different resolution, it can be used to load better resolution maps when the user zooms in. Flanders Marine Institute, Vismijn Pakhuis 49 , 8400 Oostende Belgium