Download
1 / 19
190 likes | 327 Views
This study focuses on the sediment transport and deposition dynamics in the Hudson River estuary, particularly emphasizing the effects of salinity fronts and extreme storm events, like Tropical Storms Irene and Lee. Findings reveal that high sediment concentrations and deposition rates occur at various locations influenced by salinity gradients, especially during flood tides. The research highlights the significant contribution of sediment during extreme events, with implications for sediment residence times and contaminant mobilization. Understanding these processes is crucial for better management of estuarine environments.

E N D
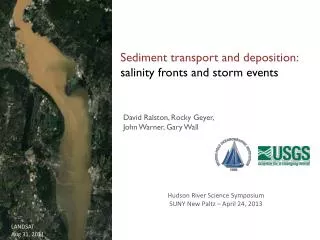
Sediment transport and deposition:salinity fronts and storm events David Ralston, Rocky Geyer,John Warner, Gary Wall Hudson River Science SymposiumSUNY New Paltz – April 24, 2013 LANDSATAug 31, 2011
Estuaries efficiently trap sediment High sediment concentrations and deposition rates, efficient trapping estuarine circulation seaward flow unstratified stratified River Ocean ETM Fluvial sediment 1 psu 15 psu 30 psu Marine sediment deposition How does the Hudson compare with this cartoon?
Hudson River estuary Poughkeepsie 120 km Salinity intrusion at low Qr 95 km Newburgh Bay 60 km Haverstraw Bay Tappan Zee 45 km High Qr GW Bridge 18 km Battery 0 km Average sediment input ~0.5 Mtons/yr
Lower Hudson ETM: near GW Bridge high deposition rates 0 50 cm June 1998 June 1999 NYC AtlanticOcean Woodruff et al. 2001
Lower Hudson ETM: near GW Bridge • high deposition rates • high sediment concentrations (>1 g/L) BUT, at intermediate salinities, not at salinity limit Geyer et al. 2001 AtlanticOcean
Upper Hudson ETM? Haverstraw Bay High deposition rates in Haverstraw; frequent dredging NYC Nitsche et al., 2010 AtlanticOcean
Upper Hudson ETM:Haverstraw Bay High sediment concentrations observed at flood tide salinity fronts Suspended sediment concentration Salinity Ralston et al., 2012
Salinity intrusion Advances during neaptides, retreats during springtides N S N S N S N S N S bottom salinity Distance from Battery (km) model results, Fall 2009
Frontal locations distributed along the estuary At constrictions: salinity gradient intensified and persistent West Point bottom salinity gradient (s/x) Distance from Battery (km) Croton Pt. Piermont GW Bridge model results, Fall 2009
Salinity front sediment trapping: Haverstraw Bay bottom stress + sal. Salinity + bathy SSC + velocity erosion/deposition+ sal. Net over 1 tidal cycle Slack before flood model results, Fall 2009
Salinity front sediment trapping: GW Bridge erosion/deposition+ sal. salinity + bathy stress + sal. SSC + velocity Net over 1 tidal cycle Slack before flood model results, Fall 2009
Tropical Storms Irene and Lee • Extremely high discharge: introduce new sediment, push salt seaward • added almost 3 Mton of new sediment to the Hudson where did it go? Mohawk River @ Cohoes 8/29/11, 2.2 g/L (G. Wall)
Tropical Storms Irene and Lee: discharge and sediment flux net sediment flux past Poughkeepsie only ~ 1/3 total input model consistent with observed fluxes data from USGS & HRECOS
Tropical Storms Irene and Lee Irene end Where did the new sediment go? Mass distributions along the Hudson through time Irene start model results
Tropical Storms Irene and Lee Where did the new sediment go? Mass distributions along the Hudson through time After Lee Before Lee model results
Tropical Storms Irene and Lee Where did the new sediment go? Mass distributions along the Hudson through time 1 mo. after Lee model results
Irene and Lee Suspended sediment New sediment largely in the tidal river Sediment in estuary remobilized by increased velocities & reduced stratification model results
1 month after Tropical Storm Lee Bed sediment erosion & deposition New sediment deposition model results
Summary - Salinity fronts at topographic transitions trap sediment at multiple locations in estuary - Sediment loading from extreme events greatly exceeds near-term transport capacity, with trapping in both tidal river and estuary • What’s next? • Transport and trapping processes in tidal river not well documented or understood • Extreme events remobilize bed sedimentsin estuary, potentially with contaminants that had been sequestered • Sediment residence times may be much longer than thought, limiting export of carbon and other terrigenous material to the ocean