Download
1 / 16
160 likes | 395 Views
LISA Short Course Series R Statistical Analysis. Ning Wang Summer 2013 . LISA: R Statistical Analysis. Summer 2013. Laboratory for Interdisciplinary Statistical Analysis. LISA helps VT researchers benefit from the use of Statistics. Collaboration:

E N D
LISA Short Course SeriesR Statistical Analysis Ning Wang Summer 2013 LISA: R Statistical Analysis Summer 2013
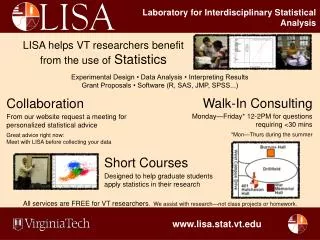
Laboratory for Interdisciplinary Statistical Analysis LISA helps VT researchers benefit from the use ofStatistics Collaboration: Visit our website to request personalized statistical advice and assistance with: Experimental Design • Data Analysis • Interpreting ResultsGrant Proposals • Software (R, SAS, JMP, SPSS...) LISA statistical collaborators aim to explain concepts in ways useful for your research. Great advice right now: Meet with LISA before collecting your data. LISA also offers: Educational Short Courses:Designed to help graduate students apply statistics in their research Walk-In Consulting: M-F 1-3 PM GLC Video Conference Room for questions requiring <30 mins All services are FREE for VT researchers. We assist with research—not class projects or homework. www.lisa.stat.vt.edu
Outline • Review on plots • T-test 2.1 One sample t-test 2.2 Two sample t-test 2.3Paired T-test 2.4 Normality Assumption & Nonparametric test • ANOVA 3.1 One-way ANOVA 3.2Two-way ANOVA • Regression LISA: R Statistical Analysis Summer 2013
Review on plots • What do we actually do with a data set when it’s handed to us? • Using visual tools is a critical first step when analyzing data and it can often be sufficient in its own right! • By observing visual summaries of the data, we can: • Determine the general pattern of data • Identify outliers • Check whether the data follow some theoretical distribution • Make quick comparisons between groups of data LISA: R Statistical Analysis LISA: R Basics Summer 2013 Summer 2013
Review on plots • plot(x, y) (or equivalent plot(y~x)) scatter plot of variables x and y • pairs(cbind(x, y, z)): scatter plots matrix of variables x, y and z • hist(y): histogram • boxplot(y): boxplot • lm(y~x): fit a straight line between variable x and y LISA: R Statistical Analysis Summer 2013
T-TEST 2.1 One sample t-test Research Question: Is the mean of a population different from the null hypothesis (a nominal value)? Example: Testing whether the average mpg (Miles/(US) gallon)of cars is different from 23 mpg Hypothesis: Null hypothesis: the average mpg of cars is 23 mpg Alternative hypothesis: the average mpg of cars is not equal to(or greater/less than) 23 mpg In R: t.test(x, y = NULL, alternative = c("two.sided", "less", "greater"), mu = 0, paired = FALSE, var.equal = FALSE, conf.level = 0.95) LISA: R Statistical Analysis Summer 2013
T-Test 2.2 Two sample t-test Research Question: Are the means of two populations different? Example: Consider whether the average mpg of automatic cars is different from manual? Hypothesis: Null hypothesis: the average mpg of automatic cars equals to the average mpg of manual cars Alternative hypothesis: the average mpg of automatic cars is not equal to (or greater/less than) the average mpg of manual cars In R: t.test(mpg~am) t.test(mpg~am,var.equal=T) LISA: R Statistical Analysis Summer 2013
T-TEST 2.3 Sample size calculation Research Question: How many observations are needed for a given power or What is the power of the test given a sample size? Power = probability rejecting null when null is false In R: power.t.test(n = NULL, delta = NULL, sd = 1, sig.level = 0.05, power = NULL, type = c("two.sample", "one.sample", "paired"), alternative = c("two.sided", "one.sided"), strict = FALSE) Calculate power given a sample size: power.t.test(delta=2,sd=2,power=.8) Calculate the sample size given a power: power.t.test(n=20, delta=2, sd=2) LISA: R Statistical Analysis Summer 2013
T-TEST 2.4 Paired T-test Research Question: Given the paired structure of the data are the means of two sets of observations significantly different? Example: a study was conducted to generate electricity from wave power at sea. Two different procedures were tested for a variety of wave types with one of each type tested on every wave. The question of interest is whether bending stress differs for the two mooring methods. In R: t.test(method1,method2,paired=T) or : t.test(diff), diff=method1-method2 LISA: R Statistical Analysis Summer 2013
T-TEST 2.5 Checking assumptions & Nonparametric test Using t-test, we assume the data follows a normal distribution, to check this normal assumption: visualization and statistical test. Visualization Histogram: shape of normal distribution: symetric, bell-shape with rapidly dying tails. QQ-plot: plot the theoretical quintiles of the normal distribution and the quintiles of the data, straight line shows assumption hold. Statistical Test: Shapiro-Wilk Normality Test In R: shapiro.test(data) LISA: R Statistical Analysis Summer 2013
T-TEST 2.5 Checking assumptions & Nonparametric test When the normal assumption does not hold, we use the alternative nonparametric test. Wilcoxon Signed Rank Test Null hypothesis: meandifference between the pairs is zero Alternative hypothesis: mean difference is not zero In R: wilcox.test(x, y = NULL, alternative = c("two.sided", "less", "greater"), mu = 0, paired = FALSE, exact = NULL, correct = TRUE, conf.int = FALSE, conf.level = 0.95, ...) LISA: R Statistical Analysis Summer 2013
ANOVA--Analysis Of Variance T-test: Compare the mean of a population to a nominal value or compare the means of equivalence for two populations How about compare the means of more than two populations? We use ANOVA! One-Way ANOVA: Compare the means of populations where the variation are attributed to the different levels of one factor. Two-Way ANOVA: Compare the means of populations where the variation are attributed to the different levels of two factors. LISA: R Statistical Analysis Summer 2013
ANOVA--Analysis Of Variance • One-way ANOVA Example: Compare the mpg for 3 cyllevels mtcars data: mpg: Miles/(US) gallon cyl: Number of cylinders am: Transmission (0 = automatic, 1 = manual) Hypothesis: Null hypothesis: null hypothesis the three levels have equal mpg Alternative hypothesis: at least two levels do not have equalmpg In R: aov(mpg~factor(cyl)) and summary(a.1) LISA: R Statistical Analysis Summer 2013
ANOVA--Analysis Of Variance 2. Two-way ANOVA Example: Compare the mpg for 3 cyllevels and 2 types of transmission Three effects to be considered: cyl levels, types of transmission and the interactions In R: a.2 = aov(mpg~factor(am)*factor(cyl)) and summary(a.2) LISA: R Statistical Analysis Summer 2013
Regression Research Question: What the relationship between two variables? Or one variable with several other variables? Example: Brownlee's Stack Loss Plant Data Air.Flow: Flow of cooling air Water.Temp: Cooling Water Inlet Temperature AcidConc.: Concentration of acid [per 1000, minus 500] stack.loss: Stack loss What is the relationship of Air.Flow and the stack.loss? Or How are the variables Air.Flow, Water.Temp and Acid.Conc related to stack.loss? In R: lm(formula, data, subset, weights, na.action, method = "qr", model = TRUE, x = FALSE, y = FALSE, qr = TRUE, singular.ok = TRUE, contrasts = NULL, offset, ...) LISA: R Statistical Analysis Summer 2013
Please don’t forget to fill the sign in sheet and to complete the survey that will be sent to you by email. Thank you! LISA: R Statistical Analysis Summer 2013