Download
1 / 52
530 likes | 740 Views
Statistical analysis using R. Written by: عواطف المطيري سناء أبو نصرة نوره المسعود خلود باسالم العنود الزغيبي زهراء الكعبي Presented by: نوره المسعود أمل المحيسن. Outline. Introduction. What & Why R Brief Navigation of R.

E N D
Written by: عواطف المطيري سناء أبو نصرة نوره المسعود خلود باسالم العنود الزغيبي زهراء الكعبي Presented by: نوره المسعود أمل المحيسن
Outline • Introduction. What & Why R • Brief Navigation of R. • Types of R objects and Data. • Basic Command in R. • Matrices. • Some Statistical Distributions. • Graphics.
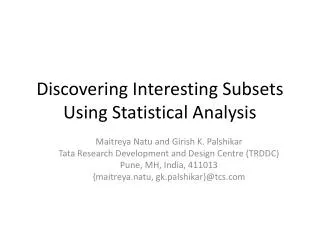
Once you have collected quantitative data, you will have a lot of numbers. • It’s now time to carry out some statistical analysis to make sense of, • and draw some inferences from, your data. • There is a wide range of possible techniques that you can use. • We will provides a brief summary of some of the most common techniques for summarizing • your data, and explains when you would use each one by using R Statisticalanalysis
R is a programming language. • R is an open-source software environment for statistical computing and graphics . • R works with a command-line interface, meaning you type in commands telling R what to do . • For more information and to download R, visit Cran.r-project.org What is R ?
Why learn R ? • It supports larger data sets. Excel ~ 1 Million , R~2 Billion vector index limit • Faster. i.e. 100K in excel ~15 mins vs 1M ~30 second • It reads any type of data. • Availability of instant access to over 7800 packages customized for various computation tasks. • Get high performance computing experience. • Advanced Statistics capabilities. • The community support is overwhelming. There are numerous forums to help you out. For example: • Numerous Discipline Specific R Groups • Numerous Local R User Groups (including R-Ladies Groups) • Stack Overflow • Learning Resources (quantity and quality) • R books • (Free Online) R Books • https://www.datasciencecentral.com/profiles/blogs/600-websites-about-r Reproducibility (important for detecting errors)
How to install R and R Studio ? https://www.youtube.com/watch?v=Ohnk9hcxf9M&feature=youtu.be R studio ( nice editor and features ) Getting started with R
R studio R script (work space) Files,plot,packages,help CONSOLE
If you need to check the current working directory use :getwd() If you need to change the current working directory use the following step : Working directory
To get more information on any built-in R commands, simply type the following and this will bring up a separate help page. Help in R
From your spreadsheet editing program (Excel, Google Docs, etc ) save your spreadsheet as a csv. File on your computer. In R, decide on a name for your dataset. Usually a short name relevant to the particular dataset is best. Lets assume you picked the name (mydata). Type Loading Data
R packages • Installation install.packages(“packagename") 2. Loading Library(packagename) 3. Use ?packagename
You can scroll back to previous commands typed by using the `up' arrow key and `down' to scroll back again. • Youcanalso `copy' and `paste' usingstandardwindowseditortechniques (forexample, usingthe `copy' and `paste' dialogbuttons). • If at any point you want to save the transcript of your session, click on `File' and then `Save', which will enable you to save a copy of the commands you have used for later use. • Asanalternativeyoumightcopyandpastecommandsmanuallyinto a notepadeditororsomethingsimilar. Youfinishan R sessionbytyping • > q( ) . Saved files
What is an object? • Numeric :(Real Numbers) • Integer : (Whole Numbers) • character • Logical (True / False) • complex Five basic classes of objects
Example • <- c(1.8, 4.5) #numeric • b <- c(1 + 2i, 3 - 6i) #complex • d <- c(23, 44) #integer • e <- rep(c("Male”,Female"),each=5)
Data Types in R • Vector: a vector contains object of same class. Ex: bar <- 0:5 • Matrices: When a vector is introduced with row and column i.e. a dimension attribute, it becomes a matrix. A matrix is represented by set of rows and columns. It is a 2 dimensional data structure. It consist of elements of same class. Ex: my_matrix <- matrix(1:6, nrow=3, ncol=2) • Data Frame: This is the most commonly used member of data types family. It is used to store tabular data. It is different from matrix. In a matrix, every element must have same class. But, in a data frame, you can put list of vectors containing different classes. • Ex: df <- data.frame(name = c(“Sara",“Wafa",“Norah",“Reem"), score = c(67,56,87,91)) • List: A list is a special type of vector which contain elements of different data types. • Ex: my_list <- list(22, "ab", TRUE, 1 + 2i)
Transpose Multiplication Inverse
Discrete Probability Distributions The binomial distribution: X is Binomial Distribution with n=20 trials and p=1/6 probability of success X~BIN(n=20 ,p=1/6)
Discrete Probability Distributions The Poisson distribution: X is Poisson Distribution with =2 X~Pois(2)
Continuous Probability Distributions The Normal distribution: X is Normal Distribution with µ=3 and =4 , X~N(3,4)
Continuous Probability Distributions The Exponentialdistribution:
1- Bar Graph is a graphical display of data using bars of different heights. is a graphical display of data using bars of different heights. Example:
2- pie Graph a special chart that uses "pie slices" to show relative sizes of data. is a graphical display of data using bars of different heights. Example:
3- Line Graph: a graph that shows information that is connected in some way (such as change over time) Example:
4- Histogram Graph graphical display of data using bars of different heights. is a graphical display of data using bars of different heights. Example:
5- Scatter plot Each point represents the values of two variables. One variable is chosen in the horizontal axis and another in the vertical axis. Example: