Download
1 / 24
240 likes | 491 Views
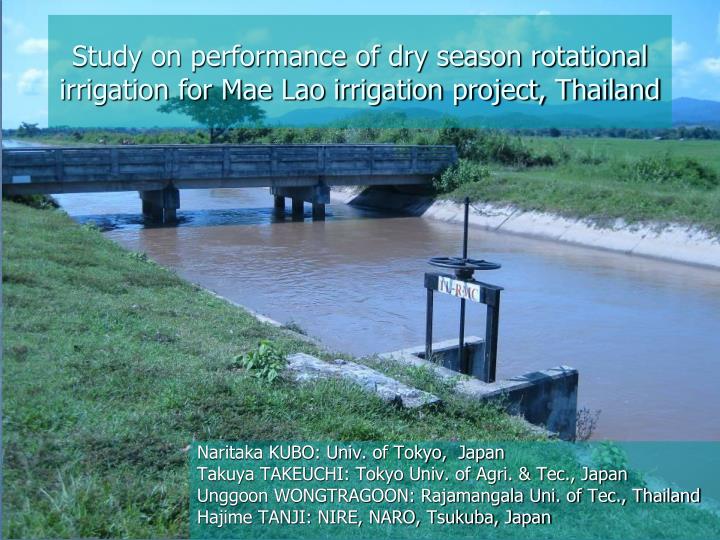
Study on performance of dry season rotational irrigation for Mae Lao irrigation project, Thailand. Naritaka KUBO: Univ. of Tokyo, Japan Takuya TAKEUCHI: Tokyo Univ. of Agri. & Tec., Japan Unggoon WONGTRAGOON: Rajamangala Uni. of Tec., Thailand Hajime TANJI: NIRE, NARO, Tsukuba, Japan.

E N D
Study on performance of dry season rotational irrigation for Mae Lao irrigation project, Thailand Naritaka KUBO: Univ. of Tokyo, Japan Takuya TAKEUCHI: Tokyo Univ. of Agri. & Tec., Japan Unggoon WONGTRAGOON: Rajamangala Uni. of Tec., Thailand Hajime TANJI: NIRE, NARO, Tsukuba, Japan
Back Ground In south east Asian countries… • Irrigation projects were developed primarily for supplemental supply during rainy season • Constructing new reservoirs makes irrigation possible during dry season Water supply is not enough • Restricted irrigation areas because of scare water • Necessity of effective water use
Mae Lao Project site Mae Lao irrigation scheme • Tributary of the Kok River belonging to Mekong River basin • Chiang Rai in North Thailand • Irrigation Area : 23680 ha
Branch 4 5,600 ha Left Main Canal Mae Lao river Mae Suai Dam Branch 1 7,968 ha Mae Lao weir Branch 2 5,264 ha Right Main Canal Branch 3 4,848 ha Laterals Streams 0 5 10 km Mae Lao project site Mae Suai Dam Mae Lao Weir Right Main Canal (RMC) - RMC length :about 50 km - Secondary canals : 23 - Max Q: about 27 m3/s 18,080 ha
Water deficit in dry season • Interviews • Branch 1 ・Water deficit occurs partially • Branch 2 ・Irrigation area is expanded beyond allotted area ・Water deficit occurs in downstream areas • Branch 3 ・Water deficit is serious ・No water comes to downstream areas
Summary of interviews • Mae Suai Dam can store 73,000,000 m3 • Low distribution efficiency • Unequal water distribution • Functional problems • Managerial problems • Illegal activities Problem identification
Objectives Quantitative analysis of effects of facilitiesand water management on water distribution performance 1. Planning phase • Continuous irrigation by non-uniform flow model • Effects by physical causes of facilities & structures 2. Execution phase • Rotational irrigation simulated by UIWDC model • Effects by managerial & institutional causes
Methodology • Numerical simulation by UIWDC model(Unggoon et al., 2010) (Unsteady Irrigation Water Distribution and Consumption) • Water consumption in paddy field ⇒Paddy Tank model • Water movement in canal ⇒1-D unsteady flow model Saint-Venant Equations inundated Plow layer A:Area, Q:Flow, q:side flow, h:depth, g:gravitational acceleration, S0:bed slope, Sf:friction slope, u:mean velocity Ground Water
HW PF Direct withdrawal 1L PF PF Paddy field Direct withdrawal PF 2L CK PF CK Check structure Direct withdrawal PF PF 3L PF PF CK Direct withdrawal PF PF PF 4L PF PF PF CK Modeling of irrigation system Branch 1 Branch 2 5L~12L Branch 3 13L~22L
Intake flow rate (IFR) 1. Based on water requirement Qs 2. Base on non-uniform flow calculation Qe(considering physical properties) Assumptions for Calculation • Equal water distribution within a branch • Daily water consumption in paddy field:14.7 mm/day • Each branch is calculated independently • Total paddy field area in Branch i : Ai • Scheduled area to be irrigated in Branch i : Asi
to be irrigated PF PF PF PF not to be irrigated 1. Calculation of scheduled IFR Qs • Exact water volume to irrigate area of Asi ⇒ Scheduled Qsi for Branch i • Based on water requirement =Paddy water consumption ×Asi + Seepage loss Canal seepage losses are calculated assuming Full Supply Level
2. Calculation of equilibrium IFR Qe • Calculated by numerical simulation for non-uniform flow • IFR at equilibrium (useless spillage=deficit) deficit ⇒Equilibrium Qei for Branch i Paddy field canal Spillage Canal seepage loss considering Non-uniform Flow Level Inlet of FTO
Scheduled area ratio (Asi/Ai) Intake Flow Rate (m3/s) Result (1)Scheduled area vs. IFR Q Maximum Flow Rate 27 m3/sec • Scheduled Qsi & Equilibrium Qei • No differences at no seepage losses → caused by seepage losses • Lower water level than that of FSL • Longer distance causes more losses
Branch 1 Branch 2 Branch 3 WSR Scheduled area ratio (SAR Asi/Ai) Result (2)Scheduled area vs. WSR • WSR = [Actually distributed water]/[Volume to be distributed] (Water supply ratio) More difficult withdrawal Lower WSR • Larger canal section • Lower water level • Higher threshold of FTO More upstream
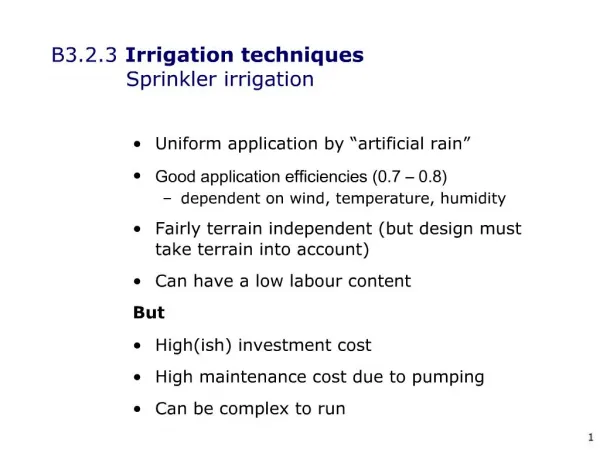
Rotational irrigation (execution phase) • Intake Flow Rate Q : 10 m3/s • Field water supply : 3 times of daily water requirement 5 days • Observance of rotation : Upstream branches do not withdraw water during off-turn • Strict application rule: Water withdrawal stops when ponded water exceeds 100 mm depth, and irrigation re-starts at 80 % of soil moisture 5 days 5 days
Water management conditions • Planning water management(Type O) • Observance of rotation • Strict application rule • Possible water managements • Type A : Direct FTOs use riparian right and application rule is strict • Type B : All FTOs observe rotation and application rule is not strict • Type AB : Direct FTOs use riparian right and application rule is not strict
WSR WSR Branch 1 Branch 2 Branch 3 Branch 1 Branch 2 Branch 3 Result (3)WSR corresponding to water management types Along RMC Along lateral canal 1. Low WSR for Branch 1 along RMC 2. High WSR for Branch 2 along RMC at AB type management 3. Low WSR for Branch 3 along lateral canal at AB type management
WSR Branch 1 Branch 2 Branch 3 Upstream Downstream Result (4) Direct FTO WSRalong RMC based on type O O Larger cross section High inlet of FTO Lower water level Difficult withdrawal
WSR Branch 2 Branch 3 WSR Branch 2 Branch 3 Result (5) Direct FTO WSR in Branches 2 and 3, along RMC based on types of O and AB Sure water withdrawal Excessive withdrawal at off-rotation O AB
WSR 13L 14L 15L 17L 17La 18L 19L 20L 21L 22L WSR 13L 14L 15L 17L 17La 18L 19L 20L 21L 22L Result (6) FTO WSRat laterals in Branch 3 based on types of O and AB Excessive withdrawal at midstream Water deficit at downstream O AB
Conclusion • Water distribution performance is influenced by structures and strictness of water management • Influence by structures Water withdrawal is restricted when water level is low. • Influence by strictness of water management One of two observances of rules improves water distribution performance considerably • Other wise Excessive withdrawal at middle branch Serious water deficit at downstream branch