Download
1 / 27
270 likes | 400 Views
Detection of topological patterns in protein networks. Sergei Maslov Department of Physics, Brookhaven National Laboratory. In collaboration with Kim Sneppen Niels Bohr Institute, Denmark. Networks in complex systems. Network is the backbone of a complex system

E N D
Detection of topological patterns in protein networks Sergei Maslov Department of Physics, Brookhaven National Laboratory In collaboration with Kim Sneppen Niels Bohr Institute, Denmark
Networks in complex systems • Network is the backbone of a complex system • Answers the question: who interacts with whom? • Recently studied networks: • Biological networks: interacting biomolecules (metabolic, physical, regulatory); food webs in ecosystems • Technological networks: Internet and WWW • Social networks: collaborations between scientists, sexual contacts within a population (important for disease prevention!)
Why study networks? • Studying networks is simpler than full dynamics of a complex system! • Large networks may contain information about design principles and/or evolution of the complex system • Lots of easily available data • Studies of networks are similar to paleontology: learning about an animal from its backbone
Transcription regulatory network in baker’s yeast • Downloaded from the YPD database: 1276 regulations among 682 proteins by 125 transcription factors (10 regulated genes per TF) • Part of a bigger genetic regulatory network of 1772 regulations among 908 proteins • Positive to negative ratio 3:1 • Broader distribution of out-degrees (up to 72) and more narrow of in-degrees (up to 21)
Transcription regulatory network in Homo Sapiens • Data courtesy of Ariadne Genomics obtained from the literature search: 1449 regulations among 689 proteins • Positive to negative ratio is 3:1 (again!) • Broader distribution of out-degrees (up to 95) and more narrow of in-degrees (up to 40)
Transcription regulatory network in E. coli • Data (courtesy of Uri Alon) was curated from the Regulon database: 606 interactions between 424 operons (by 116 TFs) • Positive to negative ratio is 3:2 (different from eukaryots!) • Broader distribution of out-degrees (up to 85) and more narrow of in-degrees (only up to 6 !)
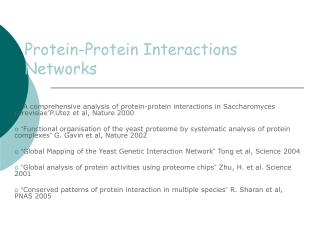
Yeast protein interaction network Data from the high-throughput two-hybrid experiment (T. Ito, et al. PNAS (2001) ) The full set containing 4549 interactions among 3278 yeast proteins 87% nodes in the largest component The highest connected protein interacts with 285 others! Figure shows only nuclear proteins
Common properties of complex (biological) networks • Very connected (one giant cluster plus a few very small ones) • Broaddistribution of connectivities: hubs interacting with many neighbors, low-connected nodes with just a few neighbors, and everything in-between. • No apparent modularity, connections seem to be quite random
Random vs designed/evolved features • Which features of a large complex network are random? • Which features are there for a reason: • design principles (e.g. feed-forward loops) • constraints (e.g. the all nodes on the Internet must be connected to each other) • evolution, growth dynamics (e.g. network growth is mainly due to gene duplication)
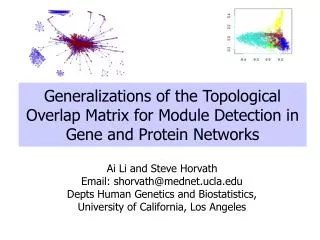
How to detect design elements of a large complex network? • Compare the abundance of some topological property in the real and properly randomized networks: • S. Maslov, K. Sneppen, Science, 296, 910 (2002): correlation profiles in protein networks in yeast (S. Cerevisiae) • S.S. Shen-Orr, R. Milo, S. Mangan, and U. Alon, Nature Genetics, 31(1):64-68 (2002): network motifs(small loops) in regulatory network in E.coli. • S. Maslov, K. Sneppen, and U. Alon, in the “Handbook of graphs and networks” to be published by Wiley Publishing House (2002). • S. Maslov, K. Sneppen, cond-mat/0205379, correlation profile of the Internet
Simplest random network • Erdos-Renyi model: randomly draw E edges between N nodes • Conserves only the average number of neighbors (connectivity) of a node <k>=2E/N • No hubs!Narrow distribution of connectivities
Random network with a given set of connectivities • Broad distribution of connectivities is the common feature of many complex networks • The exact distribution of connectivities affects topological characteristics (e.g. large component exists if <k2>/<k> > 2) • Connectivity is an important individual property of a node • Connectivities of individual nodes have to be conserved in a random network!
How to prepare such a random network? • Stub reconnection algorithm(M. E. Newman, et al, 2001, also known in mathematical literature since 1960s) • Break every edge in two “edge stubs”AB to AB • Randomly reconnect stubs • Problems: • Leads to multiple edges • Cannot be modified to preserve additional topological properties
Local rewiring algorithm • Randomly select and rewire two edges (Maslov, Sneppen, 2002, also known in mathematical literature since 1960s) • Repeat many times • Preserves both the number of upstream and downstream neighbors of each nodes
Conserving additional low-level topological properties • In addition to ki one may also conserve: • The exact numbers of loops or other motifs • The size and numbers of components: Internet – all nodes have to be connected to each other • Metropolis algorithm: two edges are rewired based on E=(Nactual-Ndesired)2/Ndesired • If E0 rewiring step is always accepted • If E>0 rewiring step is accepted with p=exp(-E/T)
Correlation profile of a network • Detects preferences in linking of nodes to each other based on their connectivity • Measure N(k0,k1) – the number of edges between nodes with connectivities k0 and k1 • Compare it to Nr(k0,k1) – the same property in a properly randomizednetwork • Very noise-tolerant with respect to both false positives and negatives
Correlation profile of the protein interaction network R(k0,k1)=N(k0,k1)/Nr(k0,k1) Z(k0,k1)=(N(k0,k1)-Nr(k0,k1))/Nr(k0,k1)
Correlation profile of the yeast regulatory network R(kout, kin)=N(kout, kin)/Nr(kout,kin) Z(kout,kin)=(N(kout,kin)-Nr(kout,kin))/ Nr(kout,kin)
What it may all mean? • Natural modules in the network are centered around individual hubs • These modules are weakly connected to each other (“soft compartmentalization”) -> links between hubs are suppressed • Reduces the amount of cross-talk, and increases the stability of the network against deleterious perturbations and its evolvability.
Some networks may appear similar In both networks P(k) is reasonably well fitted with a scale free form k- with ~2.2-2.5
Correlation profiles give complex networks unique identities Protein interactions Internet
Uri Alon’s network motifs • Compared the abundance of small loopsin E. coli transcription regulatory network to its randomized counterpart (S.S. Shen-Orr, R. Milo, S. Mangan, and U. Alon, Nature Genetics, 31(1):64-68 (2002)) • There are 13 types of 3-node connected, directed subgraphs • Only Feed-Forward Loops (FFL)were significantly over-represented (40 in real vs 7+/- 5 in random)
Coherent vs incoherent FFLs • In E.coli only coherent feed-forward loops were over represented • Coherent FFL - sign-sensitive filter • Incoherent FFL – sign-sensitive differentiator
Conclusions • Nonrandom features of large complex networks can be detected by comparison with their randomized counterparts that conservessomelow-level features e.g. connectivities of nodes, numbers of loops, etc. • Correlation profile: correlations in connectivities of neighboring nodes • Network motifs: numbers and types of small loops • Papers + Matlab programs are available at: http://cmth.phy.bnl.gov/~maslov