Download
1 / 18
180 likes | 317 Views
This comprehensive guide delves into early maritime observations, covering key theories such as Redfield's Whirlwind Theory and methods of analyzing weather fronts. It explores the mechanics of atmospheric rotation and convergence, culminating in a unified surface analysis manual that emphasizes the importance of accurate isobar plotting. The text addresses common pitfalls in weather mapping, clarifies surface symbols, and enforces individual progress in quizzes while encouraging collaborative learning on weekly maps. An essential resource for meteorology students and professionals alike.

E N D
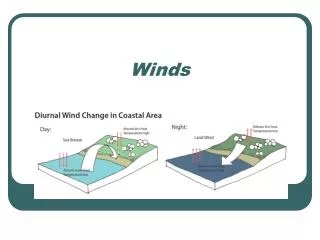
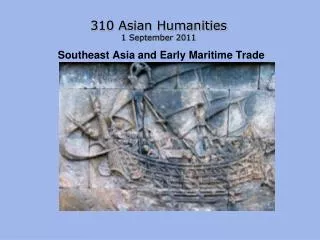
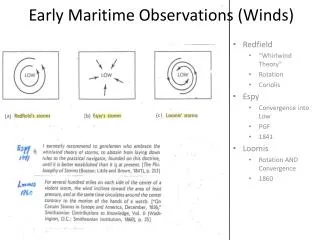
Early Maritime Observations (Winds) Redfield “Whirlwind Theory” Rotation Coriolis Espy Convergence into Low PGF 1841 Loomis Rotation AND Convergence 1860
Is the Norwegian Model Still Relevant?Unified Surface Analysis Manual
The Station Model You are expected to already know how to read this Pressure in this example is 1024.7mb Isobars: - The standard contour is simply a quasi-universal starting point for plotting, and is 1000mb - The contour interval is the change in value between isobars. It will be 4mb or less (2mb or 1mb for mesoscale) - Intermediate isobars are drawn in areas of slight pressure gradient and are ½ the value of the general map contour interval - Regular contours are solid lines, intermediates are long dash, nested intermediates are short dash and you may not jump to 1mb intermediates without first using 2mb intervals
Some Standard Surface Symbols • Frontolysis and frontogenesis will be covered later • Ignore squall line, ridge, tropical wave: we do not plot the last two and use a different conven-tion for squall lines • Troughs may be colored brown, purple or black • Drylines (ignore for now) may be colored brown or orange
Reminders (things you should already know) • Look over the error sheet when doing your weekly maps and try to avoid those most obvious mistakes • Front Type is determined by air movement on cold side of boundary • Front Location is determined by careful analysis of: • Pressure troughs • Wind shifts • Temperature and dewpoint gradients • Cloud and precipitation location • Pressure tendencies
For Those Away at AMS… • Class Policy (please keep these in mind): • Working together on weekly maps is ENCOURAGED and RECOMMENDED • Working together on weekly quizzes is considered CHEATING, these are designed to test individual knowledge and progress • Pre-Test • Print this and individually list the errors (do not work together on this) • Do not include the jumpy nature of the isobars, this is an artifact of the crappy software I used, but, yes, isobars should be neat and smooth • Quiz 1 • Print this and individually answer the questions and mark the appropriate maps. Have your glasses ready if needed, the numbers are very small • Map 1 • Print this, preferably on 11x17-inch paper (if available), and analyze: • Fronts, highs and lows (proper symbols and color) • Isobars (4mb intervals, 1000mb standard contour, label isobars, use regular black pencil)