Download
1 / 52
520 likes | 690 Views
A Statistical Analysis of the GOES-12 Sounder Derived Lifted Index. Jared Rennie Satellite Meteorology December 12 th , 2008. Overview. Introduction Background Data and Methodology Results Conclusions Summary Questions. Introduction. Convective Initiation

E N D
A Statistical Analysis of the GOES-12 Sounder Derived Lifted Index Jared Rennie Satellite Meteorology December 12th, 2008
Overview • Introduction • Background • Data and Methodology • Results • Conclusions • Summary • Questions
Introduction • Convective Initiation • Forecasters rely on severe weather indices to get a sense of where a storm forms, and whether it strengthens or dissipates • Convective Available Potential Energy (CAPE) • Lifted Index (LI)
Introduction (con’t) • Resolution Issues • 60 to 70 radiosondes launched across the US • 00Z and 12Z (sometimes 06Z and 18Z) • Poor spatial and temporal resolution • Solution • Derived Product Imagery
Introduction (con’t) Derived Product Imagery Implemented on the GOES 8 Sounder which launched in April 1994 Can construct vertical profiles of temperature, moisture and ozone Can derive values such as Total Precipitable Water CAPE Lifted Index Menzel and Purdom (1994)
Introduction (con’t) Previous Research from Satellite Meteorology Students Total Precipitable Water Latitudinal Effects (Fusco 2006) Longitudinal Effects (Balschmiter 2007) CAPE (Belge 2007) Lifted Index ?
Background • Derived Product Imagery • Lifted Index • GOES-12 Sounder • Belge (2007)
1) Derived Product Imagery • Able to produce images of • Lifted Index • CAPE • Precipitable Water • Surface Skin Temperature • Temporal Resolution: Every Hour • Spatial Resolution: “10km” Menzel and Purdom (1994)
1) DPI (con’t) • Uses a non-linear physical retrieval algorithm 1) Provides a first guess estimate 2) Radiances are calculated • From Plank’s Blackbody term 3) If the generalized error is small • vertical profile is constructed 4) If the error is large • First guess modified Kidder and Vonder Haar (1995)
1) DPI (con’t) • 19 Channels • 1 Visible • Cloud detection • 18 Infrared • Rotational transitions of • Carbon Dioxide • Water Vapor • Ozone • Surface skin temperature Menzel and Purdom (1994)
1) DPI (con’t) • Previous Tests • Compare DPI values to Radiosonde values • Problem • True values? • Error of 1K • Advected by mean flow • Radiosonde = Point Value • Sounder = Volumetric Measurement Kidder and Vonder Haar (1995) COMET (2006)
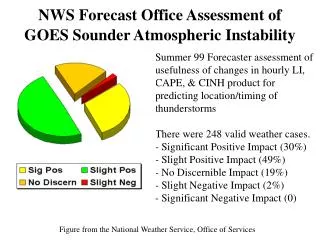
1) DPI (con’t) • CIMMS • GOES-8 Sounder DPI vs. • Radiosonde Data • NGM First guess field • Results • GOES LI less stable than Radiosonde • 0.6° C • RMSE of 2.2° C • GOES LI less stable than NGM • 0.4° • RMSE of 2.4° C COMET (2006)
2) Lifted Index • Lifting a parcel in the boundary layer to 500 hPa and comparing • The parcel temperature at 500 hPa • The environmental temperature at 500 hPa LI = TE 500 hPa – T P 500 hPa Galway (1956)
2) Lifted Index (con’t) • T and Td are averaged over the first 100 hPa above the surface • Lifted from 50 hPa above the surface to 500 hPa. • Positive Value • Parcel colder than environment • Stable • Negative Value • Parcel warmer than environment • Unstable Galway (1956)
2) Lifted Index (con’t) • Calculating LI through DPI • Estimates the incremental temperature for the boundary layer • Added to the forecasted temperature profile over the first 100 hPa of the atmosphere • Does the same for mixing ratio to create Td • Lifted to 500 hPa to generate the parcel temperature • Subtracted from the environment 500 hPa temp, which is taken directly from the forecast Hayden et al (1996)
3) GOES-12 Sounder OSO (2008)
3) GOES-12 Sounder (con’t) • For each channel • Four detectors, 10km apart, create scan lines with scan spots every “10 km” • Scan Spot • Circular • Field Of View • Area it sees is only 8.7km in diameter Miller (2008)
4) Belge (2007) • Tested values of CAPE for three stations • Albany, NY • Norman, OK • Miami, FL • January and June of 2006 • Results • Miami had the best correlation • R2 value of 0.661 • RMS 415 Jkg-1 Belge (2007)
4) Belge (2007) [con’t] • Miami, FL • Closer to the equator / sub-satellite point • Lower slant range from the satellite. • Because of the better results from Florida • This research will compare GOES derived and radiosonde calculated lifted index for the Florida area only. Belge (2007)
What is the correlation between the GOES Sounder and RAOB-based calculations of LI in Florida, and how does this correlation vary by season?
Data and Methodology • Data will be taken from four stations in Florida • Tallahassee (KTLH) • Jacksonville (KJAX) • Tampa Bay (KTBW) • Miami (KMFL) • January, March, June, September 2007 • 00Z and 12Z
Data and Methodology (con’t) • Radiosonde Data • Considered the “true” value • University Of Wyoming’s Department Of Atmospheric Sciences • Script was run to extract the date and LI values from a raw text file • Placed in a more formal file used for the statistical analysis
Data and Methodology (con’t) • Sounder Data • GOES-12 Sounder • Cooperative Institution for Meteorological Satellite Studies at the University of Wisconsin-Madison Space Science and Engineering Center • Area Files for each day at 00Z and 12Z • Viewed in McIDAS
Data and Methodology (con’t) Issue 1 Images showed values of Lifted Index, but when probed, only brightness values showed Fixed using a linear interpolation equation from current imagery on the CIMMS server Invoked on this dataset
Data and Methodology (con’t) Issue 2 Probing a 10km by 10km pixel Good representation? Solution 15 X 15 pixel grid was probed via McIDAS Center of grid was one of the Florida stations Barnes Analysis
Data and Methodology (con’t) Barnes Analysis Determines the value at a grid point based on observations falling within a specific radius of the grid point The closer the observation value is to the grid point, the higher weight it will have on the final result Smoothing Parameter of 50km Barnes (1964)
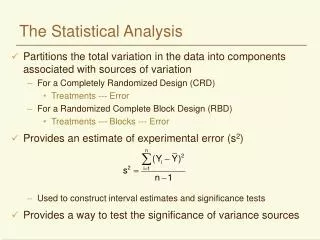
Data and Methodology (con’t) Final Steps Quality Control on Barnes Results If 200 or more pixels were contaminated by cloud cover, they were disregarded Statistics “True” estimates of LI (Radiosonde) Derived estimates of LI (Sounder) Tested for correlation Linear Regression R2 value RMSE Bias
Conclusions Miami had the best results Lowest RMSE (1.59) while conserving a high correlation (R2 value 0.92) Closer to equator and sub-satellite point 00Z vs. 12Z Both had high correlations 00Z had lower RMSE and bias values
Conclusions (con’t) January and March High Correlations High RMSE values June and September Poor Correlations Low RMSE values Due to large temperature and moisture fluxes near the surface?
Conclusions (con’t) 1) Sounding retrievals Many assumptions, biases, and problems Instrumentation and cloud contamination could affect the results 2) Radiosondes Assumed to be the “true” values for this project (not always the case) Their own problems Errors on the order of 1 degree Kelvin
Conclusions (con’t) 3) Data Only dealt with one area of the United States Can still increase the sample size Winter : DJF Spring: MAM Summer: JJA Fall: SON Use another data set for comparison Rapid Update Cycle
Summary This research attempted to test the validity of GOES-12 Sounder Derived Lifted Index Data was taken from four stations, over four months, and tested for correlation Best results near the equator Promising results for the non-convective months of January and March Poor results for the convective months of June and September
Summary (con’t) Many assumptions and problems Still produced some good results Should be taken with a “grain of salt”