Landscaping Service Pricing Strategy
Learn about the dynamics of pricing for a landscaping service business, exploring scenarios and strategies for quantity supplied and activation. Understand the concept of supply in relation to pricing decisions and market conditions.

Landscaping Service Pricing Strategy
E N D
Presentation Transcript
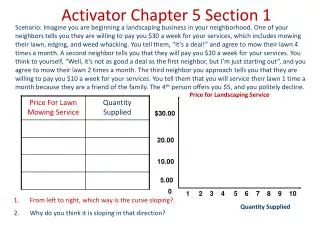
Price for Landscaping Service Quantity Supplied Activator Chapter 5 Section 1 Scenario: Imagine you are beginning a landscaping business in your neighborhood. One of your neighbors tells you they are willing to pay you $30 a week for your services, which includes mowing their lawn, edging, and weed whacking. You tell them, “It’s a deal!” and agree to mow their lawn 4 times a month. A second neighbor tells you that they will pay you $20 a week for your services. You think to yourself, “Well, it’s not as good a deal as the first neighbor, but I’m just starting out”, and you agree to mow their lawn 2 times a month. The third neighbor you approach tells you that they are willing to pay you $10 a week for your services. You tell them that you will service their lawn 1 time a month because they are a friend of the family. The 4th person offers you $5, and you politely decline. $30.00 20.00 10.00 5.00 0 1 2 3 4 5 6 7 8 9 10 • From left to right, which way is the curve sloping? • Why do you think it is sloping in that direction?
Price for Landscaping Service Quantity Supplied Activator Chapter 5 Section 1 Scenario: Imagine you are beginning a landscaping business in your neighborhood. One of your neighbors tells you they are willing to pay you $30 a week for your services, which includes mowing their lawn, edging, and weed whacking. You tell them, “It’s a deal!” and agree to mow their lawn 4 times a month. A second neighbor tells you that they will pay you $20 a week for your services. You think to yourself, “Well, it’s not as good a deal as the first neighbor, but I’m just starting out”, and you agree to mow their lawn 2 times a month. The third neighbor you approach tells you that they are willing to pay you $10 a week for your services. You tell them that you will service their lawn 1 time a month because they are a friend of the family. The 4th person offers you $5, and you politely decline. $30.00 20.00 10.00 5.00 0 1 2 3 4 5 6 7 8 9 10 • From left to right, which way is the curve sloping? • Why do you think it is sloping in that direction?
Chapter 5 - SupplySection 1 – Understanding Supply • Supply – the amount of good and services available in the marketplace. • The amount of a product that would be offered for sale at all possible prices that could prevail in the market
The Law of Supply • Law of Supply – the higher the price offered, the larger the quantity produced by the supplier; the lower prices offered, the lower quantity supplied • Direct (positive) relationship between price and the QS of a product. PriceAs Prices Increase SupplyQuantity Supplied Increases Price AsPrices Fall Supply Quantity Supplied Falls
http://www.youtube.com/watch?v=kffacxfA7G4&feature=player_detailpage#t=0shttp://www.youtube.com/watch?v=kffacxfA7G4&feature=player_detailpage#t=0s The Law of Supply Two reasons for law of supply: • Increased Production - Suppliers will produce more in order to earn additional revenue • Market Entry - New firms will also enter the market to earn profit
Price per slice of pizza $3.00 2.50 2.00 1.50 1.00 0.50 0 100 150 200 250 300 350 Quantity Supplied of Slices of Pizza The Supply Schedule and Curve • Supply Schedule - a table that lists the quantity supplied of a good that a specific supplier will produce at each price in a market • Market Supply Schedule - lists the quantity supplied of a good that all firms will produce at each price in the market • Supply Curve - A graphic representation of the individual or market supply schedule
Application – Changes in Supply Price $30.00 20.00 10.00 0 1 2 3 4 5 6 7 8 9 10 Quantity Supplied Scenario: You have been producing for a number of months at the same rate in your landscaping business. In fact, many of your neighbors have requested your services. However, you have previously been unable to fulfill their demand for your services because you are still a full time student and you have to share your time running your business with your time at school. However, the past three months of revenue have allowed you to upgrade your lawnmower from a push to a riding lawnmower. You also recently purchased a gas powered weed whacker and edger. This allows you to increase your production rate as a result of increased efficiency. Unfortunately, a month into your new production rates gas prices triple. This causes you to have to cut back on production and decrease your supply. Plot the new supply schedules on your supply curve. S3 S1 S2
Section 3 - Shifts of the Supply Curve • Changes in supply are reflected on the Supply Graph as a shift in the curve • Shifts to the right indicate an increase in supply • Shifts to the left indicate a decrease in supply Price Increase in supply Decrease in supply S 2 S 3 S 1 0 Quantity Supplied
Difference Between A Change in Quantity Supplied and a Change in Supply • QS - A change in the amount a supplier will produce as a result of a change in price • Reflected as movement along the curve • S – A change in the amount a supplier can produce as a result of an outside factor (i.e. investment in new machinery in lawn business) • Reflected as a shift in the curve
Effects of Rising Costs • Input Prices – the cost of production based on the materials necessary to produce (inputs) • Increase in input prices will cause a reduction of production • Decrease in input prices will cause incentive to produce and increase supply http://www.youtube.com/watch?v=wDdy-iNU-Vk&list=FLYtay8jXCpSl6ImxtKXk4iQ&index=34&feature=plpp_video
Technology • Technology – ability to produce based on capital goods • Increases in ability to produce as firms invest in capital goods • Decrease as a result of faulty technology or breakdowns in equipment
http://www.youtube.com/watch?v=PVUJHlfaGeY&list=FLYtay8jXCpSl6ImxtKXk4iQ&index=37&feature=plpp_videohttp://www.youtube.com/watch?v=PVUJHlfaGeY&list=FLYtay8jXCpSl6ImxtKXk4iQ&index=37&feature=plpp_video Subsidies • Subsidy – a government payment that supports a business or market • Increases in ability to produce as government protect some industries through subsidizing • Decrease as a result of government removing subsidies
http://www.youtube.com/watch?v=eafiTJ9FVMQ&list=FLYtay8jXCpSl6ImxtKXk4iQ&index=39&feature=plpp_videohttp://www.youtube.com/watch?v=eafiTJ9FVMQ&list=FLYtay8jXCpSl6ImxtKXk4iQ&index=39&feature=plpp_video Taxes • Excise tax – tax on the production or sale of a good • Increases in ability to produce as government removes taxes • Decrease as government imposes taxes
Regulation • Regulation – government intervention in a market that affects the price, quantity or quality of a good. • Increases in ability to produce as government deregulates • Decrease as government increases regulation
Future Expectations of Prices • Expectations – refers to the way suppliers think about the future, as it relates to production • Negative expectations for the future of a market can cause suppliers to shut down production in the short term • Positive speculation for the future of a market can cause suppliers to increase production and bring more suppliers to the market
Number of Sellers • Number of sellers – an increase in the number of sellers can cause an increase or decrease in the supply of goods and services • Increase in sellers, increase in production • Decrease in sellers, decrease in production
Application – Average Supply of Specialty Coffee in Southeast Georgia • Plot the supply schedules below on the same graph. The schedules represents the market supply for coffee during the early 2000’s at various price points. During the late 2000’s the demand for specialty coffee became increasingly popular. As a result a number of companies such as McDonalds and Joe’s Coffee entered the marketplace. During the late 2000’s, the federal government placed major taxes on coffee beans, which increased a the cost for a basic input and had an effect on specialty coffee suppliers.
Price $3.00 1.50 1.00 .50 0 2 4 6 8 10 12 Quantity Supplied Application – Shift in Market Supply Curve S2 S3 S1 2.50 2.00
What Causes a Shift in Supply?Determinants of Supply • Effects of Rising Costs • Technology • Subsidies • Taxes • Regulations • Future Expectations of Prices • Number of Suppliers • Group Assignment (pg. 116-120): • Create a scenario that represents each of the six determinants of supply. • You must show how your determinant can increase and decrease supply.
Ch. 5 Section 2 – Costs of Production • What is the marginal product of labor from one laborer to two?_______________ • What is the marginal product of labor from two laborers to three? ________________ • At what number of laborers does the marginal product of labor start to decline? _________________ • At what number of laborers does the firm experience negative marginal product of labor? ___________
Ch. 5 Section 2 – Costs of Production • What is the marginal product of labor from one laborer to two?_______________ • What is the marginal product of labor from two laborers to three? ________________ • At what number of laborers does the marginal product of labor start to decline? _________________ • At what number of laborers does the firm experience negative marginal product of labor? ___________
Ch. 5 Section 2 – Costs of Production • What is the marginal product of labor from one laborer to two?_______________ • What is the marginal product of labor from two laborers to three? ________________ • At what number of laborers does the marginal product of labor start to decline? _________________ • At what number of laborers does the firm experience negative marginal product of labor? ___________
Ch. 5 Section 2 – Costs of Production • What is the marginal product of labor from one laborer to two?_______________ • What is the marginal product of labor from two laborers to three? ________________ • At what number of laborers does the marginal product of labor start to decline? _________________ • At what number of laborers does the firm experience negative marginal product of labor? ___________
Ch. 5 Section 2 – Costs of Production • What is the marginal product of labor from one laborer to two?_______________ • What is the marginal product of labor from two laborers to three? ________________ • At what number of laborers does the marginal product of labor start to decline? _________________ • At what number of laborers does the firm experience negative marginal product of labor? ___________
Ch. 5 Section 2 – Costs of Production • What is the marginal product of labor from one laborer to two?_______________ • What is the marginal product of labor from two laborers to three? ________________ • At what number of laborers does the marginal product of labor start to decline? _________________ • At what number of laborers does the firm experience negative marginal product of labor? ___________
Ch. 5 Section 2 – Costs of Production • What is the marginal product of labor from one laborer to two?_______________ • What is the marginal product of labor from two laborers to three? ________________ • At what number of laborers does the marginal product of labor start to decline? _________________ • At what number of laborers does the firm experience negative marginal product of labor? ___________
Ch. 5 Section 2 – Costs of Production • What is the marginal product of labor from one laborer to two?_______________ • What is the marginal product of labor from two laborers to three? ________________ • At what number of laborers does the marginal product of labor start to decline? _________________ • At what number of laborers does the firm experience negative marginal product of labor? ___________
Ch. 5 Section 2 – Costs of Production • What is the marginal product of labor from one laborer to two?_______________ • What is the marginal product of labor from two laborers to three? ________________ • At what number of laborers does the marginal product of labor start to decline? _________________ • At what number of laborers does the firm experience negative marginal product of labor? ___________
Ch. 5 Section 2 – Costs of Production • What is the marginal product of labor from one laborer to two?_______2________ • What is the marginal product of labor from two laborers to three? ________________ • At what number of laborers does the marginal product of labor start to decline? ______ • At what number of laborers does the firm experience negative marginal product of labor? ______
Ch. 5 Section 2 – Costs of Production • What is the marginal product of labor from one laborer to two?_______2________ • What is the marginal product of labor from two laborers to three? _____1___________ • At what number of laborers does the marginal product of labor start to decline? ______ • At what number of laborers does the firm experience negative marginal product of labor? ______
Ch. 5 Section 2 – Costs of Production • What is the marginal product of labor from one laborer to two?_______2________ • What is the marginal product of labor from two laborers to three? _____1___________ • At what number of laborers does the marginal product of labor start to decline? ___4___ • At what number of laborers does the firm experience negative marginal product of labor? ______
Ch. 5 Section 2 – Costs of Production • What is the marginal product of labor from one laborer to two?_______2________ • What is the marginal product of labor from two laborers to three? _____1___________ • At what number of laborers does the marginal product of labor start to decline? ___4___ • At what number of laborers does the firm experience negative marginal product of labor? ___8___
Marginal Returns • Increasing marginal returns – Increases in output per worker added by the firm • Diminishing marginal returns – Additional workers increase total output, but at a decreasing rate • Negative Marginal Returns – Adding additional workers decreases output
Production Costs • Fixed costs – a cost that does not change no matter how much of a good is produced • Rent, salaried employees, etc. • Variable costs – costs that rise or fall depending on the quantity produced • Electricity, hourly workers, etc. • Total cost – fixed costs and variable costs added together • Marginal cost – additional cost of producing one more unit • Marginal revenue – additional income from selling one more unit of a good
At what number of laborers does the firm experience diminishing marginal returns? ________ • At what number of laborers does the firm experience negative marginal returns? _____________ Application - The Costs of Production 160
Application - The Costs of Production 160 • At what number of laborers does the firm experience diminishing marginal returns? _____________ • At what number of laborers does the firm experience negative marginal returns? _______________
Application - The Costs of Production 160 • At what number of laborers does the firm experience diminishing marginal returns? ______________ • At what number of laborers does the firm experience negative marginal returns? ________________
Application - The Costs of Production 160 • At what number of laborers does the firm experience diminishing marginal returns? _____________ • At what number of laborers does the firm experience negative marginal returns? _______________
Application - The Costs of Production 160 • At what number of laborers does the firm experience diminishing marginal returns? _____________ • At what number of laborers does the firm experience negative marginal returns? _______________
Application - The Costs of Production 160 • At what number of laborers does the firm experience diminishing marginal returns? _______6______ • At what number of laborers does the firm experience negative marginal returns? ________11_______
Application - The Costs of Production Inc. Dim. Neg. 160 Inc. Dim. Neg. • At what number of laborers does the firm experience diminishing marginal returns? _______6______ • At what number of laborers does the firm experience negative marginal returns? _________11______