Download
1 / 12
120 likes | 312 Views
North America is the largest market for fatty acids supplements globally, followed by Europe. In 2013, North America accounted for about 35% of the global consumption of omega-3 fatty acids. A growing trend towards consuming beverages with functional ingredients has offered new opportunities for the addition of omega-3, such as EPA and DHA, in beverages. According to the United Soybean Board’s Consumer Attitudes about Nutrition survey, around 84% of consumers perceived omega-3 as a healthy fatty acid in 2012; and increase from 79% in 2011.

E N D
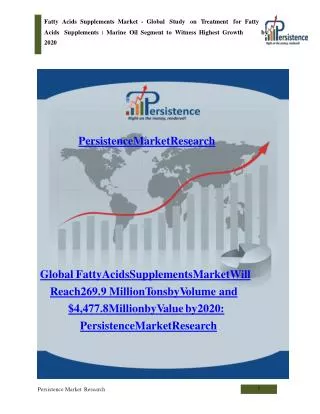
FattyAcidsSupplementsMarket-GlobalStudyonTreatmentforFatty Acids 2020 Supplements:MarineOilSegmenttoWitnessHighestGrowth by PersistenceMarketResearch GlobalFattyAcidsSupplementsMarketWill Reach269.9MillionTonsbyVolumeand $4,477.8MillionbyValueby2020: PersistenceMarketResearch 1 PersistenceMarketResearch
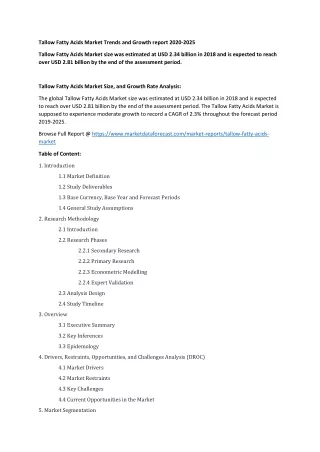
FattyAcidsSupplementsMarket-GlobalStudyonTreatmentforFatty AcidsSupplements:MarineOilSegmenttoWitnessHighestGrowthby 2020 PersistenceMarketResearchReleasedNewMarketReport“TheGlobalMarketStudyonFattyAcids Supplements:MarineOilSegmenttoWitnessHighestGrowthby2020”theglobalFattyAcids SupplementsmarketwasvaluedatUSD1,912.0millionin2013andisexpectedtogrowataCAGRof 13.1%from2014to2020,toreachanestimatedvalueofUSD4,477.8millionby2020. Increasingawarenessamongconsumersabouthealth,diet,andfitnesshashelpedimprovelifestyles greatly.Intherecentyears,consumershavebecomemoreconsciousoftheirdietintake.Fattyacidssuch asomega-3offervarioushealthbenefits.Omega-3fattyacidscompriseofacidiccontentssuchas Eicosapentaenoicacid(EPA),docosahexaenoicacid(DHA)andalpha-linolenicacid(ALA).Theseacids arerequiredforregularmetabolicactivitiesasthehumanbodycannotsynthesizetheseacidsonitsown. Omega-3EPA/DHAcontenthastheabilitytoreducethelevelofunwantedcholesterolinthehumanbody, therebyloweringtheriskofcoronaryheartdiseasesandbloodpressuredisorders.Urbanpopulationsare moreconcernedabouttheirlifestylecomparedtoruralpopulations.Thelifestyleoftheurbanpopulationis fastpaced.Fast-pacedlifestylealongwithanaspirationtostayfitattractspeopletoomega-3fattyacids. AccordingtotheUnitedNations,theurbanpopulationisexpectedtoincreasefrom3.4billionin2009to 6.3billionin2050.Withurbanizationincreasingworldwide,thistrendisexpectedtocontinuefora longperiod.Increasinghealthawarenessandmedicinalbenefitsoffattyacidsaremajorgrowthdrivers fortheglobalfattyacidssupplementsmarket.Inaddition,increasingbabyboomerspopulationis expectedtodrivetheglobalfattyacidssupplementsmarket.AccordingtothePopulationDivision oftheUnitedNationsDepartmentofEconomicandSocialAffairs(UN-DESA),therewere841million peopleaged60andabovein2013comparedto205millionin1950.Thenumberisprojectedtoreach over2billionby 2050. BrowsethefullGlobalMarketStudyonFattyAcidsSupplements:MarineOilSegmenttoWitness HighestGrowthby2020reportathttp://www.persistencemarketresearch.com/market-research/fatty-acids-supplements-market.asp NorthAmericaisthelargestmarketforfattyacidssupplementsglobally.Amajorfactorcontributingtothe growthoftheomega-3marketinEuropeistheincreasinglevelofawarenessaboutomega-3fattyacids. Asia-Pacificisthefastestgrowingandemergingmarketforomega-3.CountriessuchasIndiaandChina havehighbirthrates,whichmayboostthedemandforomega-3ingredientsininfantformula.Birthrateis maximuminIndia,around22%,followedbyChinaat12%intheAsiaPacificregion. 2 PersistenceMarketResearch
FattyAcidsSupplementsMarket-GlobalStudyonTreatmentforFatty AcidsSupplements:MarineOilSegmenttoWitnessHighestGrowthby 2020 Thefattyacidssupplementsmarketisbifurcatedintosource(marineoils,algaloils,andothers)byvalue (USDmillion)andbyvolume(milliontons),application(dietarysupplements,functionalfoodand beverages,andothers)byvalue(USDmillion)andbyvolume(milliontons),andregion(NorthAmerica, Europe,Asia-Pacific,andrestoftheworld). Intermsofvalue,theglobalfattyacidssupplementsmarketgrewfromUSD1,430.0millionin2010to USD1,912.0millionin2013ataCAGRof10.2%.Intermsofvolume,theglobalfattyacidssupplements marketgrewfrom88.5milliontonsin2010to119.4milliontonsin2013ataCAGRof10.5%. Amongtheregionalsegments,theNorthAmericanfattyacidssupplementsmarket(largestmarketin 2013)increasedby9.2%CAGRduring2010–2013toreachUSD688.3millionin2013. Theglobalfattyacidssupplementsmarketishighlyconsolidated,withthetopfivecompaniesholding 75%marketshare.DSMleadsthemarket,followedbyEpaxASandCrodaHealthCare. FattyAcidsSupplementsMarket,bySource •Marineoil •Algaloil •Others(includingflaxseedoil) FattyAcidsSupplementsMarket,byApplication •Dietarysupplements •Functionalfoodandbeverages •Others(includingpharmaceuticalsandinfantformula) FattyAcidsSupplementsMarket,byRegion •NorthAmerica •Europe 3 PersistenceMarketResearch
FattyAcidsSupplementsMarket-GlobalStudyonTreatmentforFatty AcidsSupplements:MarineOilSegmenttoWitnessHighestGrowthby 2020 •AsiaPacific •RestoftheWorld MarketHistory: Increasinghealthawarenessandmedicinalbenefitsoffattyacidsaremajorgrowthdriversfortheglobal fattyacidsmarket.Inthelastfewyears,certainhealthorganizationsfoundomegaseriesfattyacidscan aidthetreatmentofeye,hair,andheartdiseases.Increasingconsumerbaseandtechnology advancementincontrollingoxidation(tomaintainthequality,taste,andsmelloffood)inomega-3, omega-6,andomega-9forimprovedtastearealsoexpectedtodrivethedemandforfattyacids supplements.Increasingbabyboomerspopulationisexpectedtodrivetheglobalfattyacidssupplements market.AccordingtothePopulationDivisionoftheUnitedNationsDepartmentofEconomicandSocial Affairs(UN-DESA),therewere841millionpeopleaged60andabovein2013comparedto205millionin 1950.Thenumberisprojectedtoreachover2billionby2050. NorthAmericaisthelargestmarketforfattyacidssupplementsglobally.In2013,itcontributedtoaround 35%oftheglobalconsumptionofomega3fattyacids.Amajorfactorcontributingtothegrowthofthe omega-3marketinEuropeistheincreasinglevelofawarenessaboutomega-3intheregion.Intherecent years,consumershavebecomemoreconsciousoftheirdietintake.AsiaPacificisthefastestgrowing andemergingmarketforomega-3.CountriessuchasIndiaandChinahavehighbirthrates,whichmay boostthedemandforomega-3ingredientsininfantformula.BirthrateismaximuminIndia(around22%), followedbyChina12%,intheAsiaPacificregion.Omega-3fatsareusefulforimprovingvisionandaiding cognitivedevelopmentininfants.IncreasingpopulationandgrowingurbanizationinChinahasledtothe multifoldgrowthofthefattyacidssupplementsmarket. Thefattyacidssupplementsmarketisbifurcatedintosource(marineoils,algaloils,andothers)and application(dietarysupplements,functionalfoodandbeverages,andothers).Themarineoilssegment heldthelargestshareoftheoverallmarketin2013at102.7milliontons;andisexpectedtoreach235.4 milliontonsby2020,ataCAGRof12.7%fortheperiod2014–2020. Amongtheapplicationsegments,thedietarysupplementssector(largestsectorin2013)increasedby 8.5%CAGRduring2010–2013toreachUSD1,204.5millionin2013. 4 PersistenceMarketResearch
FattyAcidsSupplementsMarket-GlobalStudyonTreatmentforFatty AcidsSupplements:MarineOilSegmenttoWitnessHighestGrowthby 2020 Amongtheregionalsegments,theNorthAmericanfattyacidssupplementsmarket(largestmarketin 2013)increasedby9.2%CAGRduring2010–2013toreachUSD688.3millionin2013. Theglobalfattyacidssupplementsmarketishighlyconsolidated,withthetopfivecompaniesholdingaround75%marketshare.DSMleadsthemarket,followedbyEpaxASandCrodaHealthCare. 5 PersistenceMarketResearch
FattyAcidsSupplementsMarket-GlobalStudyonTreatmentforFatty Acids 2020 Supplements : Marine Oil Segment to Witness Highest Growth by TableofContent Chapter1Preface 1.1ReportDescription 1.1.1Segmentscoveredinthereport 1.2ResearchMethodology Chapter2MarketSynopsis Chapter3Porter’sFiveForcesModel 3.1BargainingPowerofSuppliers 3.2BargainingPowerofBuyers 3.3ThreatofNewEntrants 3.4ThreatofSubstitutes 6 PersistenceMarketResearch
FattyAcidsSupplementsMarket-GlobalStudyonTreatmentforFatty AcidsSupplements:MarineOil 2020 Segment to Witness Highest Growth by 3.5RivalryAmongCompetitors Chapter4IndustryOverview 4.1Introduction 4.2MarketDrivers 4.2.1Healthylifestyle 4.2.2Technologyadvancements 4.2.3Infantformula 4.2.4Risingagingpopulation 4.2.5Impactanalysisofmarketdrivers 4.3MarketRestraints 4.3.1Lackofawareness 4.3.2Impactanalysisofmarketrestraints 4.4Opportunities 4.4.1Highbirthratenations 4.5Challenges 4.5.1Decreasingphytoplanktons Chapter5MarketSizeandForecastbySource 5.1MarineOils 5.2AlgalOil 5.3Others(includingFlaxseed) Chapter6MarketSizeandForecastbyApplication 6.1DietarySupplements 6.2FunctionalFoodandBeverages 6.3Others(includingPharmaceuticalsandInfantFormula) Chapter7MarketSizeandForecastbyGeography 7.1NorthAmerica 7.2Europe 7.3AsiaPacific 7 PersistenceMarketResearch
FattyAcidsSupplementsMarket-GlobalStudyonTreatmentforFatty AcidsSupplements:MarineOilSegmentto 2020 Witness Highest Growth by Chapter8Omega-6andOmega-9FattyAcids,Overview 8.1Omega-6 8.1.1Healthbenefitsofomega-6 8.1.2Sources 8.1.2.1Sunfloweroil 8.1.2.2Soybeanoil 8.1.2.3Palmoil 8.2Omega-9 8.2.1Healthbenefitsofomega-9 8.2.2Sources Chapter9CompetitiveScenario 9.1GlobalFattyAcidsSupplementsMarketShare,byCompany Chapter10CompanyProfiles 10.1EpaxAS 10.1.1Companyoverview 10.1.2Productsandservices 10.1.3Financialperformance 10.1.4Recentdevelopments 10.2AristaIndustries,Inc. 10.2.1Companyoverview 10.2.2Productsandservices 10.2.3Financialperformance 10.2.4Recentdevelopments 10.3OmegaProteinCorporation 10.3.1Companyoverview 10.3.2Productsandservices 10.3.3Financialperformance 10.3.4Recentdevelopments 10.4AxellusAS 10.4.1Companyoverview 10.4.2Productsandservices 10.4.3Financialperformance 8 PersistenceMarketResearch
FattyAcidsSupplementsMarket-GlobalStudyonTreatmentforFatty AcidsSupplements:Marine 2020 Oil Segment to Witness Highest Growth by 10.4.4Recentdevelopments 10.5CopeincaAS 10.5.1Companyoverview 10.5.2Productsandservices 10.5.3Financialperformance 10.5.4Recentdevelopments 10.6CrodaHealthCare 10.6.1Companyoverview 10.6.2Productsandservices 10.6.3Financialperformance 10.6.4Recentdevelopments 10.7KoninklijkeDSMN.V. 10.7.1Companyoverview 10.7.2Productsandservices 10.7.3Financialperformance 10.7.4Recentdevelopments ListofTables TABLE1Globalfattyacidssupplementsmarketsnapshot,byvalue,2014and2020 TABLE2Globalfattyacidssupplementsmarketsnapshot,byvolume,2014and2020 TABLE3Impactanalysisofmarketdrivers TABLE4Impactanalysisofmarketrestraints TABLE5Globalfattyacidssupplementsmarket,bysource,2010–2013(milliontons) TABLE6Globalfattyacidssupplementsmarket,bysource,2014–2020(milliontons) TABLE7Globalfattyacidssupplementsmarket,bysource,2010–2013(USDmillion) TABLE8Globalfattyacidssupplementsmarket,bysource,2014–2020(USDmillion) TABLE9Marineoilsfattyacidssupplementsmarket,bygeography,2010–2013(milliontons) TABLE10Marineoilsfattyacidssupplementsmarket,bygeography,2014–2020(milliontons) TABLE11Marineoilsfattyacidssupplementsmarket,bygeography,2010–2013(USDmillion) TABLE12Marineoilsfattyacidssupplementsmarket,bygeography,2014–2020(USDmillion) TABLE13Algaloilfattyacidssupplementsmarket,bygeography,2010–2013(milliontons) TABLE14Algaloilfattyacidssupplementsmarket,bygeography,2014–2020(milliontons) TABLE15Algaloilfattyacidssupplementsmarket,bygeography,2010–2013(USDmillion) TABLE16Algaloilfattyacidssupplementsmarket,bygeography,2014–2020(USDmillion) 9 PersistenceMarketResearch
FattyAcidsSupplementsMarket-GlobalStudyonTreatmentforFatty AcidsSupplements:MarineOil 2020 SegmenttoWitnessHighestGrowthby TABLE17Others(includingflaxseed)fatty (milliontons) TABLE18Others(includingflaxseed)fatty (milliontons) acidssupplementsmarket,bygeography,2010–2013 acidssupplementsmarket,bygeography,2014–2020 TABLE19Others(includingflaxseed)fattyacidssupplementsmarket,bygeography,2010–2013(USD million) TABLE20Others(includingflaxseed)fattyacidssupplementsmarket,bygeography,2014–2020(USD million) TABLE21Globalfattyacidssupplementsmarket,byapplication,2010–2013(milliontons) TABLE22Globalfattyacidssupplementsmarket,byapplication,2014–2020(milliontons) TABLE23Globalfattyacidssupplementsmarket,byapplication,2010–2013(USDmillion) TABLE24Globalfattyacidssupplementsmarket,byapplication,2014–2020(USDmillion) TABLE25Dietarysupplementsmarket,bygeography,2010–2013(milliontons) TABLE26Dietarysupplementsmarket,bygeography,2014–2020(milliontons) TABLE27Dietarysupplementsmarket,bygeography,2010–2013(USDmillion) TABLE28Dietarysupplementsmarket,bygeography,2014–2020(USDmillion) TABLE29Functionalfoodandbeveragesmarket,bygeography,2010–2013(milliontons) TABLE30Functionalfoodandbeveragesmarket,bygeography,2014–2020(milliontons) TABLE31Functionalfoodandbeveragesmarket,bygeography,2010–2013(USDmillion) TABLE32Functionalfoodandbeveragesmarket,bygeography,2014–2020(USDmillion) TABLE33Others(includingpharmaceuticalsandinfantformula)market,bygeography,2010–2013 (milliontons) TABLE34Others(includingpharmaceuticalsandinfantformula)market,bygeography,2014–2020 (milliontons) TABLE35Others(includingpharmaceuticalsandinfantformula)market,bygeography,2010–2013 (USDmillion) TABLE36Others(includingpharmaceuticalsandinfantformula)market,bygeography,2014–2020 (USDmillion) TABLE37Globalfattyacidssupplementsmarketsize,byregion,2010–2013(milliontons) TABLE38Globalfattyacidssupplementsmarketsize,byregion,2014–2020(milliontons) TABLE39Globalfattyacidssupplementsmarketsize,byregion,2010–2013(USDmillion) TABLE40Globalfattyacidssupplementsmarketsize,byregion,2014–2020(USDmillion) TABLE41NorthAmericafattyacidssupplementsmarket,bysource,2010–2013(milliontons) TABLE42NorthAmericafattyacidssupplementsmarket,bysource,2014–2020(milliontons) 10 PersistenceMarketResearch
FattyAcidsSupplementsMarket-GlobalStudyonTreatmentforFatty AcidsSupplements:MarineOilSegmenttoWitnessHighestGrowthby 2020 TABLE43NorthAmericafattyacidssupplementsmarket,bysource,2010–2013(USDmillion) TABLE44NorthAmericafattyacidssupplementsmarket,bysource,2014–2020(USDmillion) TABLE45NorthAmericafattyacidssupplementsmarket,byapplication,2010–2013(milliontons) TABLE46NorthAmericafattyacidssupplementsmarket,byapplication,2014–2020(milliontons) TABLE47NorthAmericafattyacidssupplementsmarket,byapplication,2010–2013(USDmillion) TABLE48NorthAmericafattyacidssupplementsmarket,byapplication,2014–2020(USDmillion) TABLE49EuropeFattyacidssupplementsmarket,bysource,2010–2013(milliontons) TABLE50Europefattyacidssupplementsmarket,bysource,2014–2020(milliontons) TABLE51Europefattyacidssupplementsmarket,bysource,2010–2013(USDmillion) TABLE52Europefattyacidssupplementsmarket,bysource,2014–2020(USDmillion) TABLE53Europefattyacidssupplementsmarket,byapplication,2010–2013(milliontons) TABLE54Europefattyacidssupplementsmarket,byapplication,2014–2020(milliontons) TABLE55Europefattyacidssupplementsmarket,byapplication,2010–2013(USDmillion) TABLE56Europefattyacidssupplementsmarket,byapplication,2014–2020(USDmillion) TABLE57AsiaPacificfattyacidssupplementsmarket,bysource,2010–2013(milliontons) TABLE58AsiaPacificfattyacidssupplementsmarket,bysource,2014–2020(milliontons) TABLE59AsiaPacificfattyacidssupplementsmarket,bysource,2010–2013(USDmillion) TABLE60AsiaPacificfattyacidssupplementsmarket,bysource,2014–2020(USDmillion) TABLE61AsiaPacificfattyacidssupplementsmarket,byapplication,2010–2013(milliontons) TABLE62AsiaPacificfattyacidssupplementsmarket,byapplication,2014–2020(milliontons) TABLE63AsiaPacificfattyacidssupplementsmarket,byapplication,2010–2013(USDmillion) TABLE64AsiaPacificfattyacidssupplementsmarket,byapplication,2014–2020(USDmillion) TABLE65ProductlineofEpaxAS TABLE66AristaIndustries,Inc.productline TABLE67ProductsandsegmentsofOmegaProteinCorporation TABLE68ProductlineofAxellusAS TABLE69ProductlineofCrodaHealthCare TABLE70ProductsandproductclassificationsofDSM ListofFigures FIG.1Globalfattyacidssupplementsmarket,2010–2020(USDmillion) FIG.2Fattyacidssupplement:Porter’sfiveforcesanalysis FIG.3Globalbirthrate,2012 FIG.4Globalsunfloweroilproduction,2008–2012(millionmetrictons) 11 PersistenceMarketResearch
FattyAcidsSupplementsMarket-GlobalStudyonTreatmentforFatty AcidsSupplements:MarineOilSegmenttoWitnessHighestGrowthby 2020 FIG.5Globalsoybeanoilproduction,2008–2012(millionmetrictons) FIG.6Globalpalmoilproduction,2008–2012(millionmetrictons) FIG.7Globalfattyacidssupplementsmarketshare,bycompany,2013 FIG.8OmegaProteinCorporation’snetsalesandnetprofit,2011–2013(USDmillion) FIG.9OrklaHome&Personal’snetsalesandnetprofit,2011–2013(USDmillion) FIG.10CrodaInternationalPlc’snetsalesandnetprofit,2011–2013(USDmillion) FIG.11KoninklijkeDSMN.V.’snetsalesandprofit,2011–2013(USDmillion) AboutUs: PersistenceMarketResearchisaglobalmarketresearchfirmspecializing-syndicatedresearch,customresearch,andconsultingservices AtPersistenceMarketResearch(PMR),weareinthebusinessofacceleratingyourbusiness.Asafull- servicemarketresearchfirm,westandcommittedtobringingmoreaccuracyandspeedtoyourbusiness decisions.Fromready-to-purchasemarketresearchreportstocustomizedglobalresearchsolutions,our engagementmodelsarehighlyflexiblewithoutcompromisingonourdeep-seatedresearchvalues. Brieflystated,ourmissionistogiveyouaccesstoforecastsandtrendsanalysesthatputyouonthe pathto profitability. PMR’sServicesGoBeyondGleaningData ContactUs: AddieThomes 305Broadway,7thFloor, NewYorkCity,NY10007, UnitedStates. Tel:No.+1-646-568-77 USA/CanadaTollFreeNumber.1-800-961-0353 E-mail:Sales@persistencemarketresearch.com web:http://www.persistencemarketresearch.com/ 12 PersistenceMarketResearch