Download
1 / 75
750 likes | 1.13k Views
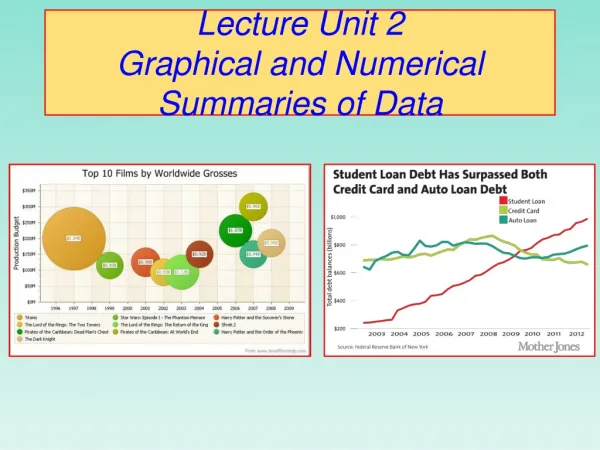
Lecture Unit 2 Graphical and Numerical Summaries of Data. Lecture Unit 2: Graphical and Numerical Summaries of Data. How Americans like their steak (Longhorn Steakhouse). UNIT OBJECTIVES At the conclusion of this unit you should be able to:

E N D
Lecture Unit 2: Graphical and Numerical Summaries of Data How Americans like their steak (Longhorn Steakhouse) UNIT OBJECTIVES At the conclusion of this unit you should be able to: • 1) Construct graphs that appropriately describe data • 2) Calculate and interpret numerical summaries of a data set. • 3) Combine numerical methods with graphical methods to analyze a data set. • 4) Apply graphical methods of summarizing data to choose appropriate numerical summaries. • 5) Apply software and/or calculators to automate graphical and numerical summary procedures.
Displaying Qualitative Data Section 2.1 “Sometimes you can see a lot just by looking.” Will Rogers (1879-1935) American humorist and social commentator
The three rules of data analysis • 1. Make a picture—reveals aspects not obvious in the raw data; enables you to think clearly about the patterns and relationships that may be hiding in your data. • 2. Make a picture —to show important features of and patterns in the data. You may also see things that you did not expect: the extraordinary (possibly wrong) data values or unexpected patterns • 3. Make a picture —the best way to tellothers about your data is with a well-chosen picture.
Bar Charts: show counts or relative frequency for each category • Example: Titanic passenger/crew distribution
Pie Charts: shows proportions of the whole in each category • Example: Titanic passenger/crew distribution
Example: Top 10 causes of death in the United States For each individual who died in the United States, we record what was the cause of death. The table above is a summary of that information.
The number of individuals who died of an accident in is approximately 100,000. Top 10 causes of death: bar graph Each category is represented by one bar. The bar’s height shows the count (or sometimes the percentage) for that particular category. Top 10 causes of deaths in the United States
Top 10 causes of deaths in the United States Bar graph sorted by rank Easy to analyze Sorted alphabetically Much less useful
Top 10 causes of death: pie chart Each slice represents a piece of one whole. The size of a slice depends on what percent of the whole this category represents. Percent of people dying from top 10 causes of death in the United States
Recent Annual Computer Hardware Sales ($billion) Recent Annual Software Sales ($billions) 1. United States $1582. China $64.43. Japan $544. Germany $24.45. Britain $23.56. France $19.37. Brazil $14.28. Italy $13.19. Australia $12.810. India $11.9 1. United States $137.92. Japan $23.43. Germany $204. Britain $16.85. France $12.66. Canada $7.37. Italy $6.38. China $5.4 9. Netherlands $5.410. Australia $4.8 NY Times
Internships Basic bar chart Side-by-side bar chart
Trend, Student Debt by State (grads of public, 4 yror more) National Average: 2009-10: $21,604 2012-13: $25,043
KISS. Example: Unnecessary dimension in a pie chart 3rd dimension is unnecessary; the 3D pie chart does not convey any more information than a 2D pie chart
Contingency Tables: Categories for Two Variables • Example: Survival and class on the Titanic
Warmup Warmup Is there more to the story? We shall see. More to come.
marg. dist. of survival 710/2201 32.3% 1491/2201 67.7% 325/2201 14.8% 885/2201 40.2% marg. dist. of class 285/2201 12.9% 706/2201 32.1% Contingency Tables: Categories for Two Variables • Example: Survival and class on the Titanic Marginal distributions
Contingency Tables: Categories for Two Variables (cont.) • Conditional distributions. Given the class of a passenger, what is the chance the passenger survived?
Contingency Tables: Categories for Two Variables (cont.) Questions: • What fraction of survivors were in first class? • What fraction of passengers were in first class and survivors ? • What fraction of the first class passengers survived? 202/710 202/2201 202/325
TV viewers during the Super Bowl in 2016. What is the marginal distribution of those who watched the commercials only? • 8.0% • 23.5% • 58.2% • 27.7% 10
TV viewers during the Super Bowl in 2016. What percentage watched the game and were female? • 41.8% • 38.8% • 51.2% • 19.8% 6
TV viewers during the Super Bowl in 2016. Given that a viewer did not watch the Super Bowl telecast, what percentage were male? • 45.2% • 48.8% • 26.8% • 27.7% 7
3-Way Tables • Example: Georgia death-sentence data
LAWSUIT (cont.) A higher percentage of female applicants are admitted in 4 of the 6 majors. Now it appears that female candidates have the advantage. But it’s the same data as on the previous slide.
Warmup –cont. Warmup –cont. Simpson’s Paradox Is there more to the story? Facebook Head of Infrastructure Jay Parikh reportedly said the gap in rejection rate is not due to gender, but rank.
Simpson’s Paradox Warm-up Summary The reversal of the direction of a comparison or association when data from several groups are combined to form a single group.
American West Wins!You’re a Hero! (.856*811)+(.921*5255)+(.855*448) +(.713*449)+(.767*262)=6438.2; 6438.2/7225 = 89.1% (.889*559)+(.948*233)+(.914*232) +(.831*605)+(.858*2146)=3273.9; 3273.9/3775 = 86.7%
Section 2.2Displaying Quantitative Data Histograms Stem and Leaf Displays
Relative Frequency Histogram of Exam Grades .30 .25 .20 Relative frequency .15 .10 .05 0 40 50 60 70 80 90 100 Grade
Histograms A histogram shows three general types of information: • It provides visual indication of where the approximate center of the data is. • We can gain an understanding of the degree of spread, or variation, in the data. • We can observe the shape of the distribution.
Symmetric distribution • A distribution is skewed to the rightif the right side of the histogram (side with larger values) extends much farther out than the left side. It is skewed to the leftif the left side of the histogram extends much farther out than the right side. Skewed distribution Complex, multimodal distribution • Not all distributions have a simple overall shape, especially when there are few observations. Histograms: Shape • A distribution is symmetricif the right and left sides of the histogram are approximately mirror images of each other.
Shape (cont.)Female heart attack patients in New York state Age: left-skewed Cost: right-skewed
Shape (cont.): Outliers An important kind of deviation is an outlier. Outliersare observations that lie outside the overall pattern of a distribution. Always look for outliers and try to explain them. The overall pattern is fairly symmetrical except for 2 states clearly not belonging to the main trend. Alaska and Florida have unusual representation of the elderly in their population. A large gap in the distribution is typically a sign of an outlier. Alaska Florida
Frequency and Relative Frequency Histograms: Construction • identify smallest and largest values in data set • divide interval between largest and smallest values into between 5 and 20 subintervals called classes * each data value in one and only one class * no data value is on a boundary
Histogram Construction (cont.) * compute frequency or relative frequency of observations in each class * x-axis: class boundaries; y-axis: frequency or relative frequency scale * over each class draw a rectangle with height corresponding to the frequency or relative frequency in that class