Download
1 / 6
60 likes | 238 Views
Numerical Summaries: Measuring Center of the Data Set. Example . You want to buy a 3-4 bdrm house. Need info on real estate sales in Reno, say on 200 recently sold 3-4bdrm houses. Data : $325,300, $287,650, $589,900, $230,900, …, $455,800.

E N D
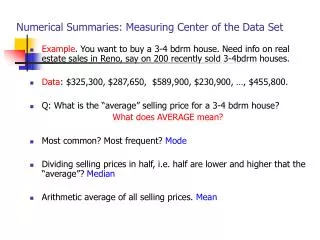
Numerical Summaries: Measuring Center of the Data Set • Example. You want to buy a 3-4 bdrm house. Need info on real estate sales in Reno, say on 200 recently sold 3-4bdrm houses. • Data: $325,300, $287,650, $589,900, $230,900, …, $455,800. • Q: What is the “average” selling price for a 3-4 bdrm house? What does AVERAGE mean? • Most common? Most frequent? Mode • Dividing selling prices in half, i.e. half are lower and higher that the “average”? Median • Arithmetic average of all selling prices. Mean
More specifically…. Sample: where, n=total number of observations=sample size is the value (observation) on the first individual, is the value (observation) on the second individual, etc. is the value (observation) on the nth individual. SAMPLE MEAN =(sum of all observations)/(the total number of observations) = (sum of all observations)/sample size = = where is the sum of all observations , from i=1 to n. Example: Data with 5 observations of quiz scores: 8, 5, 7, 3, 7. n=5, x1=8, x2=5, x3=7, x4=3, x5=7. Answer: Mean score = (8+5+7+3+7)/5=6.
MEDIAN SAMPLE MEDIAN is the “middle value” when the data is arranged in an increasing (or decreasing) order. Equal numbers of observations are larger and smaller than median. • Odd number of observations - the median is the middle, i.e. (n+1)/2th largest value. • Even number of observations - the median is the average of the two middle values, (average of the (n/2)th and (n/2+1)th observations). Example. Quiz scores: 8, 5, 7, 3, 7. Find median of the quiz scores. Step 1. Sort the data: 3, 5, 7, 7, 8. Step 2. Even or odd n? Odd. Step 3. Median is the middle observation. (n+1)/2th=(5+1)/2th=3rd observation=7=median. Let’s add an observation: New quiz data: 8, 5, 7, 6, 3, 7. Find median of the quiz scores. Step 1. Sort the data: 3, 5, 6, 7, 7, 8. Step 2. Even or odd n? Even. Step 3. Median is the average of the two middle observations. (6+7)/2=6.5=median.
MODE SAMPLE MODE is the most frequent value in the data set. Example. Quiz scores: 8, 5, 7, 3, 7. Find mode of the quiz scores. Answer: Mode is 7 because 7 is most frequent. Note that mode may not always be unique. Why?
OUTLIERS OUTLIERS – observations FAR outside the regular pattern of the data. Where do outliers come from? • Errors of measurements or recording – in those cases, people tend to disregard them. • Natural order of things – they point to very important phenomena like floods, heat waves, hurricanes, etc. Should not be discarded but studied. Example. Waiting times (in minutes) for a bus, 100 observations.
OUTLIERS AND MEASURES OF CENTER Example. Take quiz scores. 3, 5, 7, 7, 8. Suppose I made a recording error and instead of 8 recorded 88. New data: 3, 5, 7, 7, 88. New median= 7 = old median NO change, New mode = 7 = old mode NO change, New mean = (88+5+7+3+7)/5=22 LARGE change, old mean=6. MEDIAN AND MODE are RESISTANT (ROBUST) TO OUTLIERS i.e. do not change if we add outliers to a data set. MEAN IS SENSITIVE TO OUTLIERS i.e. changes if we add an outlier to a data set. Summary: If you do not want the very large or the very small (outliers) observations to affect the information you are getting about the “center” of the data ask for median rather than the mean.