Download
1 / 13
130 likes | 315 Views
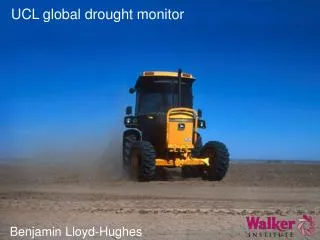
UCL global drought monitor. Benjamin Lloyd-Hughes. Apologies!. “Very sorry to be unable to join you, please accept my apologies for some rather wordy slides...”. Key message. “We’d like to emulate the best regional practices globally.” However:

E N D
UCL global drought monitor Benjamin Lloyd-Hughes
Apologies! “Very sorry to be unable to join you, please accept my apologies for some rather wordy slides...”
Key message “We’d like to emulate the best regional practices globally.” However: Regional differences in data availability mean that much of the most valuable information provided by the best national level drought monitoring systems is missing at the global scale. Thus: Transnational drought information provided by a global system will represent a compromise between completeness and consistency.
Why monitor? • Drought is a slow onset peril • True extent of impacts are difficult to recognise • Often leads to a diminished sense of urgency • Timely recognition is essential for effective mitigation • Governments recognise the need for a proactive, risk based approach to drought management: • US National Integrated Drought Information System Act (2006) • EU Communication on Water Scarcity and Droughts (2007) • Monitoring is essential to: • Quantify the risk • Trigger a response • Manage the event
Why global? • Drought can afflict any region of the planet. • It is a large scale phenomenon which does not respect national boundaries. • The impacts are frequently so severe that regional governments require international assistance. • A global perspective is essential for understanding the climatic mechanisms that drive the peril. • Fragmented approach to monitoring makes it difficult to assess the relative importance of events between nations. • Many nations are not monitored at all.
Best practice The best monitoring systems (e.g. US National Integrated Drought Information Service) Integrate: • Climate data (historic, current and forecast) • Water storage (soil moisture, snow pack, stream flow, groundwater, reservoir & lake levels) • Demand (present and projected) • Impacts (vegetative health, socioeconomic indicators) To deliver: • Timely information (routinely produced, frequently updated) • Appropriately (relevant, accessible, correct level of detail) • Reliably and consistently
UCL global drought monitor • Developed in 2005 and remains unique as a comprehensive source of globally consistent drought information. • The monitoring system has operated continuously since December 2005 and has logged over 40,000 visitors. • Limited to meteorological drought information. Several new data sources (observational and forecast) have become available since the launch of the original drought monitor. There have also been major technological developments in user generated content and interface design. The ongoing challenge is to optimally combine the available technologies and data to best serve the requirements of the user community.
User community Usage statistics from the existing Global Drought Monitor: • 45,000 hits 2006-2010
A vision for the future Operation of the UCL Global Drought Monitor has prompted feedback from a range of users from sectors including agriculture, aid, education, media, and energy. The feedback, whilst overwhelmingly positive, indicates certain areas which could be improved. The most common feature requests can be summarised as: • Inclusion of seasonal forecast data (an interesting problem given the wide spatial and seasonal variations in forecast skill). • Climate model predictions (which models? Scenarios?) • Improved mapping (in particular, improved support for Google Earth, and the provision of print quality output). • Historic data (but how far back?). • Provision of additional contextual information / ground truth via a 'Drought Impacts Reporter' (similar to that provided for the US by http://droughtreporter.unl.edu/ ).
A vision for the future • It is interesting to note that several potential enhancements which are suggested by advances in the available data (such as improved spatial and temporal resolution) are seldom, if at all, requested by the users. • The most common complaints relate to operational issues such as a failure of the monitor to update on the specified date. This indicates a need for improved operational support. A further class of complaint relates to inconsistencies between the conditions reported by the Global Drought Monitor and those reported by regional agencies. This indicates that greater effort should be made to harmonise the output of global and national tools. Realisation of the above feature requests coupled with improved consistency and operational support describe a road map toward the next generation of global drought monitor
Thank you! www.walker-insitute.reading.ac.uk