Download
1 / 22
220 likes | 242 Views
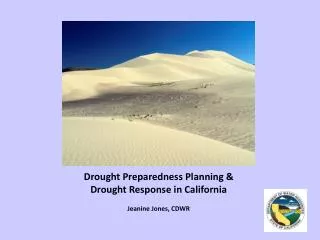
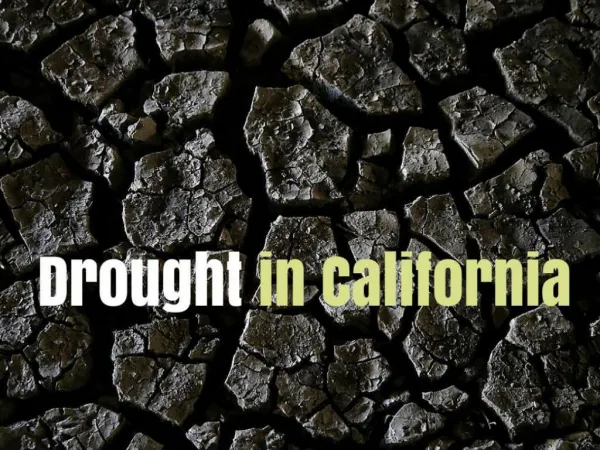
Explore the 2007 California drought through statistics, events, and the impact on engineered systems. Learn about drought levels and monitoring tools. Understand the variability in California's complex climate.

E N D
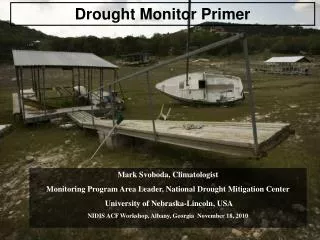
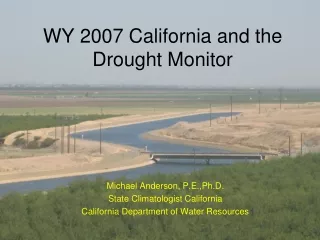
WY 2007 California and the Drought Monitor Michael Anderson, P.E.,Ph.D. State Climatologist California California Department of Water Resources
Overview • Questions • Quick Guide to CA Water • 2007 Review and DM Depiction • Some Statistics • Questions
Questions • How is drought depicted/defined in a highly variable climate? • How do you define drought levels (D0 to D4) in a mixed engineered/natural system like CA? • Can a single tool like the DM capture the variability in conditions in CA?
Year 2000 Numbers From DWR Bulletin 160
From DWR Bulletin 118
Rainfall Distribution in Time Northern CA 8 Station Index Average Precipitation 51% of Annual Precip Snowmelt Period Largest March Precip 54% of Annual Average Largest April Precip 45% of Annual Average
April 1 Snowpack Year to year variability Other droughts
WY 2007 and the DM 10/3/2006 9/18/2007 Images from Drought Monitor Archive
WY 2007 and the DM • D0 San Joaquin Nov 21, 2006 • D0 South CA Dec 5, 2006 • D1 SE CA Dec19, 2006 • D1 South CA Jan 2, 2007 • D2 SE CA Jan 16, 2007 • D3 South CA March 13, 2007 • D3 Central Coast May 22, 2007 • D3 Northern CA July 3, 2007
Events in 2007 FERC Ruling limits water transfer from Eel River to Russian River for fisheries reasons Fall 2006 Water Resources Control Board Request for Water Use Cutback On Russian River for fisheries reasons Summer 2007 Low Snowpack Judge’s Ruling Limits Delta Pumping June 2007 2nd Largest Fire in CA History (Zaca Fire, Summer) Water Emergencies Declared June 2007 Record Low Rainfall
Zaca Fire Photo: Rick Burnett
2007 Statistics • Lowest July 1, 2006 to June 30, 2007 annual rainfall for many locations in southern CA • Northern CA precipitation index recorded 26th driest year out of 88(19th driest Oct-Apr/6th driest Jan, Mar) • April to July Runoff Sacramento River10th lowest out of 101 • April to July Runoff San Joaquin River6th lowest out of 107
More Statistics • Warm March caused 20% loss of snowpack • Max T: 5th hottest out of 113 years • Mean T: 6th hottest out of 113 years • Min T: 14th hottest out of 113 years • Summer (JJA) statewide average temperatures: • Max T: 20th hottest out of 113 years • Mean T: 9th hottest out of 113 years • Min T: 4th hottest out of 113 years Temperature statistics from Western Region Climate Center’sCalifornia Climate Tracker Sacramento River at Fremont Weir, Photo by B. Lek
Drought Impact? • Beaches excel on quality of water Lack of rain cited for 'A' grades • Ventura County Star – 9/28/07 • Dry spell has kept bacteria low at beaches; Lack of storm runoff was a major factor in the marked improvements, annual report says. Clean-water projects also helped • Los Angeles Times – 9/28/07
Engineered Systems • Engineered systems buffer drought signals • Disconnect in impacts location/timing vs. natural systems • Engineered systems’ claim to nature: “I reject your reality and substitute my own”
Questions • How is drought depicted/defined in ahighly variable climate? • How do you define drought levels (D0 to D4) in a mixed engineered/natural system like CA? • Can a single tool like the DM capture the variability in conditions in CA?
Questions? manderso@water.ca.gov
Cachuma Reservoir Photo: Rick Burnett
Gibralter Dam and Reservoir Photo: Rick Burnett