Finding Consistent Subnetworks across Microarray dataset
This article details a methodology for identifying consistent subnetworks across various microarray datasets, addressing the inconsistency often observed in differential gene expression studies. By leveraging gene-gene relationships and relevant biological insights, the proposed method enhances the detection of significant subnetworks related to specific phenotypes. Using a robust scoring and significance evaluation system, the methodology overcomes limitations of traditional approaches. The findings demonstrate improved reliability and insight into disease mechanisms, paving the way for novel treatment strategies.

Finding Consistent Subnetworks across Microarray dataset
E N D
Presentation Transcript
Finding Consistent Subnetworks across Microarray dataset Fan Qi GS5002 Journal Club
Outline • Introduction • Methodology • Results & Discussions • Conclusions
Introduction • Identify Differential Gene Expression • Identify significant genes w.r.t a phenotype • Importance: • Testing effectiveness of treatment • Biological insights of diseases • Develop new treatment • Disease Prophylaxis • Any others ?
Current Methods • Individual Genes • Search for individual differentially expressed genes • Fold-change, t-test, SAM • Gene Pathway Detection • Looking at a set of genes instead of individual genes • Bayesian learning and Boolean network learning • Gene Classes • Adding existing biological insights • Over-representation analysis (ORA), Functional Class Scoring(FCS), GSEA, NEA, ErmineJ
Challenge • Different Results from Different Dataset of the SAME disease! • Zhang M [1] demonstrated inconsistency in SAM: Inconsistency among datasets Reconstruct from Table 1 in [1]
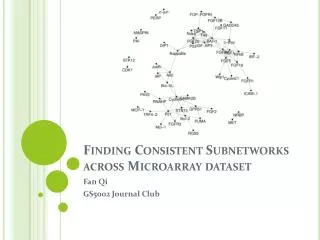
New Approach • SNet [2] • Proposed in 2011 • Utilize gene-gene relationship in analysis • Gene-gene relationship • Activates VS. Inhibits • Gene Subnetwork • Gene is the Vertex, Relationship is an edge From Fig 1 in [2] RHOA VAV PIK3R2 RAC1 IQGAP1 ARHGEF1 Partially adapted from Fig 2 in [2]
Methodology • Input: • Genes labeled with phenotype • Gain from microarray experiment • Third-party Info: • Gene Pathway Info • Gene Reaction Info • Attributes of Subnetwork • Size, Score • Output: • A set of significant sub-network Subnetwork Scoring Subnetwork Significance Subnetwork Extraction
Methodology –Step 1 Phenotypes Patient’s Gene Ranked List ……..
Methodology –Step 1 for patient Only top genes is kept Repeat for every phenotype group
Methodology –Step 1 ……. select genes occur in of patients Select one phenotype as others as
Methodology –Step 1 A list of Subnetworks w.r.t ……… Partition into multiple pathways Generate Subnetwork
Methodology – Step 2 • For each Subnetwork in in the and Patient , compute overall expression level: • = , where • a gene in that is highly expressed in • # patients in who have highly expressed • : total # patients in • For Patients and compute t-test T test Assign to each Subnetwork
Methodology – Step 3 • Randomly Swap Phenotype labels of patient, recreating subnetworks and t-test scores (step 1-2) • Repeat [A] for 1,000 permutations. • Forms a 2-D histogram () • Estimate the nominal p-value of each Subnetwork • Select Subnetwork with - Null-hypo: subnetwork with is not significant Fig 5 in original paper
Results and Discussions • Dataset: • Leukemia: Golub VS Armstrong • ALL: Ross VS Yeoh • DMD: Haslett VS Pescatori • Lung: Bhattacharjee VS Garber • Performance Comparison: • Subnetwork Overlap (with GSEA) • Gene Overlap (GSEA, SAM, t-Test) • Other Comparisons: • Network Size, Gene Validity with t-Test
Results and Discussions • Subnetwork Overlap Synthesized from Table 1, 2 from [2] Higher the better
Results and Discussions • Gene Overlap Synthesized from Table 3, 4,5 from [2] Higher the better
Results and Discussions • Size of subnetworks Reconstructed from Table 6 from [2]
Results and Discussions • Validity • Compare the genes in EACH Subnetwork with those in t-test • Genes in each Subnetwork appears in T-Test is around 70%- 100% • Selected Results (too large to present full) Selected from Table 7,8,9,10 in[2]
Conclusions • Traditional Methods have inconsistency problem across different dataset of the same disease • SNet utilize Biological insights to mitigate the gap • Gene-to-Gene relationship • Gene Pathway knowledge • SNet shows better results than established algorithms • More consistent
References • [1] Zhang M, Zhang L, Zou J, Yao C, Xiao H, Liu Q, Wang J, Wang D, Wang C, GuoZ: Evaluating reproducibility of differential expression discoveries in microarray studies by considering correlated molecular changes. • [2]Donny Soh, Difeng Dong1, YikeGuo, LimsoonWong Finding consistent disease subnetworks across microarray datasets