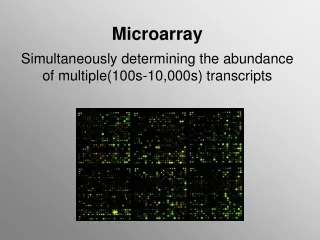
MICROARRAY
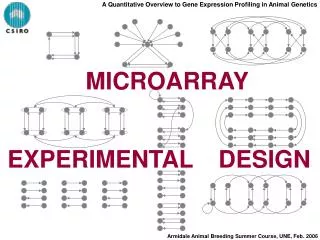
A Quantitative Overview to Gene Expression Profiling in Animal Genetics. MICROARRAY. EXPERIMENTAL. DESIGN. Armidale Animal Breeding Summer Course, UNE, Feb. 2006. A Quantitative Overview to Gene Expression Profiling in Animal Genetics. Replication: Animal Sample Array Spot.

MICROARRAY
E N D
Presentation Transcript
A Quantitative Overview to Gene Expression Profiling in Animal Genetics MICROARRAY EXPERIMENTAL DESIGN Armidale Animal Breeding Summer Course, UNE, Feb. 2006
A Quantitative Overview to Gene Expression Profiling in Animal Genetics • Replication: • Animal • Sample • Array • Spot MICROARRAY EXPERIMENTS Technical Concerns • Biochemist Level: • Preparation (Printing) of the Chip • RNA Extraction, Amplification and Hybridisation • Optical Scanner (Reading) • Quantitative Level: • Design • Image (data) Quality • Data Analysis • Data Storage Note:Randomisation intentionally neglected. Armidale Animal Breeding Summer Course, UNE, Feb. 2006
A Quantitative Overview to Gene Expression Profiling in Animal Genetics TECHNICAL CONCERNS 2.a – Data Quality: GP3xCLI Armidale Animal Breeding Summer Course, UNE, Feb. 2006
A Quantitative Overview to Gene Expression Profiling in Animal Genetics TECHNICAL CONCERNS 2.d – Data Storage: 15 PIECES OF INFORMATION PER ARRAY SPOT 3 Spatial Features ……………………………………… 1. Printing block 2. Row 3. Column 2 Channels: - Red: 2 signals: - Foreground …………. 4. Mean 5. Median 6. Std Dev - Background …………. 7. Mean 8. Median 9. Std Dev - Green: ……. - Foreground …………. 10. Mean 11. Median 12. Std Dev - Background …………. 13. Mean 14. Median 15. Std Dev 15 x 30,000 = 450,000! Armidale Animal Breeding Summer Course, UNE, Feb. 2006
A Quantitative Overview to Gene Expression Profiling in Animal Genetics TECHNICAL CONCERNS BASIC PIECES FOR SIGNAL DETECTION • Foreground RED and GREENRfGf • Background RED and GREENRbGb • Background-corrected REDR = Rf – Rb • GREENG = Gf – Gb • Log-transformed Log2(R) • Log2(G) • Difference: “Minus” M = Log2(R) – Log2(G) = Log2(R/G) • Mean: “Average” A = 0.5 * ( Log2(R) + Log2(G) ) = 0.5 * Log2(R*G) • MA-Plots …to come True Signals! Armidale Animal Breeding Summer Course, UNE, Feb. 2006
A Quantitative Overview to Gene Expression Profiling in Animal Genetics TECHNICAL CONCERNS 2.d – Data Storage: RELATIONAL DATABASES FOR MICROARRAY BASE: BioArray Software Environment: A Platform for Comprehensive Management and Analysis of Microarray DataLao H. Saal, Carl Troein, Johan Vallon-Christersson, Sofia Gruvberger, Åke Borg and Carsten PetersonGenome Biology 2002 3(8): software0003.1-0003.6 http://base.thep.lu.se/index.phtml GENA: Genomics Array DatabaseCSIRO Plant Industries & CMIS http://www.pi.csiro.au/gena/ GEXEX: Gene Expression ExperimentsCSIRO Livestock Industries https://www.biolives.li.csiro.au/gexex/ Armidale Animal Breeding Summer Course, UNE, Feb. 2006
Source Organism Slide Plate Primary_Results Slide_ID Array Source_ID Organism_Name Experiment _ID Plate_ID Primary_Results_ID Array_ID Array ID Organism_Name Description Date_Spotted Library_Name Scan_ID Date_Hybridised Library Description Ecotype_Name Plate_Size Scan Spot_ID Bio_Replicate_No Ecotype Library_Name Mutant_Line_Name Tech_Replicate_No Source Spot Scan_ID Ch1_Median Sample_X_ID Ecotype_Name Description Treatment X_Labelling_Info Location Spot_ID Slide_ID Bulk_Sample Ch1_Mean Sample_Y_ID Description Owner Bulk_ID Y_Labelling_Info Organism_Name PI_Sequence_ID Tissue Date Ch2_Median Bulked_Date Secondary_Results Bulked_By Mutant_Line Ecotype_Name Array_ID Tissue_Name Time Ch2_Mean Secondary_Results_ID Mutant_Line_Name Tissue_Name Array_Block Description Scan_ID Description Expt_Keyword Expt_Sample Array_Row Spot_ID Amplification Keyword Experiment_ID Experiment_ID Array_Col Treatment Dia Amplification_ID Keyword Keyword Sample_ID Treatment_Name Etc…. Plate_ID Description Sequence Description Date_Amplified Experiment Norm_Results_1 PI_Sequence_ID Norm_Results_2 Gel_Photo Experiment_ID Norm_Results_3 Clone_ID ExptGroup ExptGroup_Expt Primary_Results_ID Category Description Scan_ID Function Group_Type Group_Type Well_Amplification Spot_ID Category Category Accession_No Ch1_Median Description Experiment_ID Amplification_ID Ch1_Mean Description Accession_No_Source Sequence Ch2_Median Well_ID Ch2_Mean Sequence Time_Course_Period Status Concentration Microarray Database Schema Sample Sample_ID Sample_Bulk_Sample Source_ID Bulk_ID Bulk_ID Sample_ID Tissue_Name Collection_Date Owner Location Slide_Amplification Slide_ID Amplification_ID Plate_Well Well_ID Plate_ID PI_Sequence_ID Plate_Row Microarray Database Schema G. Kennedy CSIRO Plant Industry V1.1 26/3/2001 Plate_Col Origin_Well_ID
A Quantitative Overview to Gene Expression Profiling in Animal Genetics TECHNICAL CONCERNS 2.a – Data Storage: OPINION The level of sophistication becomes so high that it is unrealistic to expect an automatic adoption of this system by the end user. SOLUTION A simple intuitive graphical interface warehousing system to simultaneously access (i) details of the design configuration, and (ii) the entire raw data. Armidale Animal Breeding Summer Course, UNE, Feb. 2006
A Quantitative Overview to Gene Expression Profiling in Animal Genetics TECHNICAL CONCERNS 2.a – Data Storage: GEXEX Armidale Animal Breeding Summer Course, UNE, Feb. 2006
A Quantitative Overview to Gene Expression Profiling in Animal Genetics TECHNICAL CONCERNS 2.a – Data Storage: GEXEX Armidale Animal Breeding Summer Course, UNE, Feb. 2006
A Quantitative Overview to Gene Expression Profiling in Animal Genetics TECHNICAL CONCERNS 2.a – Data Storage: GEXEX Armidale Animal Breeding Summer Course, UNE, Feb. 2006
A Quantitative Overview to Gene Expression Profiling in Animal Genetics MICROARRAY EXPERIMENTAL DESIGN “Biologists interested in gene expression profiling should feel free to match experimental design to their particular situation; there is no universal microarray design. A careful grounding in the principles of experimental design will help to ensure that we will accumulate knowledge and not just enormous amount of data.” Churchill & Oliver, 2001. Sex, flies, and microarrays. Nature Genetics, 29:355. • Accommodate your software to your design, not the other way around. • Beef CRC Database • Type I Error (False Positives) • Type III Error (Correctly detecting an effect, but • Incorrectly attributing the cause). Armidale Animal Breeding Summer Course, UNE, Feb. 2006
A Quantitative Overview to Gene Expression Profiling in Animal Genetics Put more arrays on key questions Pooling? $ • Dye-Swap • Dye-Balancing • Self-Self Evaluation of Designs: O A O A O A B AB B AB B AB Loop All-Pairs Reference Variance of Estimated Effects(Relative to the All-Pairs) Reference 1 1 3 2 Loop 4/3 1 8/3 1 All-Pairs 1 1 2 1 Main effect of A Main effect of B Interaction AB Contrast A-B MICROARRAY EXPERIMENTAL DESIGN Key Issues: • Identify/Prioritise Questions • N of Available Samples • N of Available Arrays • Consider Dye Bias Armidale Animal Breeding Summer Course, UNE, Feb. 2006
A Quantitative Overview to Gene Expression Profiling in Animal Genetics The ratio: estimates A - AB = + MICROARRAY EXPERIMENTAL DESIGN Wt Gain, Kg A O B AB Disease Model: O = A = + B = + AB = + + + Armidale Animal Breeding Summer Course, UNE, Feb. 2006
A Quantitative Overview to Gene Expression Profiling in Animal Genetics MICROARRAY EXPERIMENTAL DESIGN Model: O = A = + B = + AB = + + + A O B AB Armidale Animal Breeding Summer Course, UNE, Feb. 2006
A Quantitative Overview to Gene Expression Profiling in Animal Genetics All Pairs Model: O = A = + B = + AB = + + + A O B AB Armidale Animal Breeding Summer Course, UNE, Feb. 2006
A Quantitative Overview to Gene Expression Profiling in Animal Genetics Reference Model: O = A = + B = + AB = + + + A O B AB Armidale Animal Breeding Summer Course, UNE, Feb. 2006
A Quantitative Overview to Gene Expression Profiling in Animal Genetics Loop Model: O = A = + B = + AB = + + + A O B AB Armidale Animal Breeding Summer Course, UNE, Feb. 2006
A Quantitative Overview to Gene Expression Profiling in Animal Genetics Evaluation of Designs: O A O A O A B AB B AB B AB Loop All-Pairs Reference Variance of Estimated Effects(Relative to the All-Pairs) Reference 1 1 3 2 Loop 4/3 1 8/3 1 All-Pairs 1 1 2 1 Main effect of A Main effect of B Interaction AB Contrast A-B Armidale Animal Breeding Summer Course, UNE, Feb. 2006
A Quantitative Overview to Gene Expression Profiling in Animal Genetics MICROARRAY EXPERIMENTAL DESIGN (Time-course) Yang & Speed, 2002 3 slides 4 slides Armidale Animal Breeding Summer Course, UNE, Feb. 2006
A Quantitative Overview to Gene Expression Profiling in Animal Genetics MICROARRAY EXPERIMENTAL DESIGN Multiple Dye-Swap Reference Loop Conclusion: Relative size of e2 to p2 will dictate the optimal design Kerr 2003. Biometrics 59:822-828 Armidale Animal Breeding Summer Course, UNE, Feb. 2006
A Quantitative Overview to Gene Expression Profiling in Animal Genetics MICROARRAY EXPERIMENTAL DESIGN Multiple Dye-Swap Reference Loop 12 Chips 24 Chips 12 Chips Conclusion: Loops require as many chips as samples Armidale Animal Breeding Summer Course, UNE, Feb. 2006
A Quantitative Overview to Gene Expression Profiling in Animal Genetics • Samples vs Slides vs Configurations Samples (S) 3 4 12 (S-1) 2 3 11 Arrays S(S-1) 6 12 132 MICROARRAY EXPERIMENTAL DESIGN Glonek & SolomonFactorial and Time Course Designs for cDNA Microarray Experiments • Definition • A design with a total of n slides and design matrix X is said to be admissible • if there exists no other design with n slides and design matrix X* such that • ci* ci • For all i with strict inequality for at least one i. Where ci* and ci are respectively • the diagonal elements of (X*’X*)-1 and (X’X)-1. N of Configurations? Armidale Animal Breeding Summer Course, UNE, Feb. 2006
A Quantitative Overview to Gene Expression Profiling in Animal Genetics N of Configurations? SA-1 Armidale Animal Breeding Summer Course, UNE, Feb. 2006
A Quantitative Overview to Gene Expression Profiling in Animal Genetics N of Configurations? Wool Pigmentation Pie-Bald black Non-Pie-Bald black Normal White Recessive SA-1 = 53 = 125 Armidale Animal Breeding Summer Course, UNE, Feb. 2006
A Quantitative Overview to Gene Expression Profiling in Animal Genetics x5 x5 x5 x5 x5 x5 x5 x5 x5 x5 x5 x5 x5 x5 x5 x5 x5 x5 x5 x5 x5 x5 x5 x5 x5 Armidale Animal Breeding Summer Course, UNE, Feb. 2006
A Quantitative Overview to Gene Expression Profiling in Animal Genetics N of Configurations? 0 hr 24 hr SA-1 = 109 = 1 Billion! Armidale Animal Breeding Summer Course, UNE, Feb. 2006
A Quantitative Overview to Gene Expression Profiling in Animal Genetics Transitivity (Townsend, 2003) & Extendability (Kerr, 2003) Opt 2: 10 Slides Opt 1: 10 Slides Opt 3: 11 Slides Opt 4: 9 Slides Opt 5: 9 Slides Armidale Animal Breeding Summer Course, UNE, Feb. 2006
A Quantitative Overview to Gene Expression Profiling in Animal Genetics MICROARRAY EXPERIMENTAL DESIGN Take home message I: “Identify the effects of interest a priori” In addition to experimental constraints, design decisions should be guided by the knowledge of which effects are of greater interest to the investigator. E.g. which main effects, which interactions. The experimenter should thus decide on the comparisons for which he wants the most precision and these should be made within slides to the extent possible. Armidale Animal Breeding Summer Course, UNE, Feb. 2006
A Quantitative Overview to Gene Expression Profiling in Animal Genetics Is this pooled sample better than 4 individual “normal” samples? Wool Pigmentation Armidale Animal Breeding Summer Course, UNE, Feb. 2006
A Quantitative Overview to Gene Expression Profiling in Animal Genetics Handling Constraints (Samples & Arrays): Pooling & Replication • Pavlidis et al.(2003) The effect of replication on gene • Expression microarray experiments. Bioinformatics 19:1620 >= 5 Replicates 10-15 Replicates • Peng et al.(2003) Statistical implications of pooling RNA • Samples for microarray experiments. BMC Bioinformatics 4:26 • Kendziordski et al. (2005) On the utility of biological samples in microarray experiments. PNAS 102:4252. Power: n9c9 95%, n3c3 50%, n9c3 90% n25c5 n20c20 Armidale Animal Breeding Summer Course, UNE, Feb. 2006
A Quantitative Overview to Gene Expression Profiling in Animal Genetics Handling Constraints (Samples & Arrays): Pooling & Replication • Peng et al.(2003) Statistical implications of pooling RNA • Samples for microarray experiments. BMC Bioinformatics 4:26 Power: n9c9 95%, n3c3 50%, n9c3 90% n25c5 n20c20 Armidale Animal Breeding Summer Course, UNE, Feb. 2006
A Quantitative Overview to Gene Expression Profiling in Animal Genetics Take home message II: “In the cases where we do not have enough material from one biological sample to perform one array (chip) hybridizations, Pooling or Amplification are necessary” Pooling vs Individual Samples • Pooling is seen as “Biological Averaging”. • Trade off between: Cost of performing a hybridization • Cost of the mRNA samples. • IF Cost or mRNA samples << cost per hybridization • THEN Pooling can assists reducing the number of hybridization. Pooling vs Amplified Samples • Amplification Introduces more noise. • Non-linear amplification (??), ≠ genes amplified at ≠ rate. • Able to perform more hybridizations. • Pooling Less replicates hybridizations. Armidale Animal Breeding Summer Course, UNE, Feb. 2006
A Quantitative Overview to Gene Expression Profiling in Animal Genetics Pooling & Replication R G F HS G R R M TM G R N of Arrays? F HS 24: 23 To 552 R G pooling M HS G G G G R F TM 14: 13 To 182 R R R M HS R R G G G F HS R G R G M HS R G Armidale Animal Breeding Summer Course, UNE, Feb. 2006
A Quantitative Overview to Gene Expression Profiling in Animal Genetics Pooling & Replication Reference Design Sum(ABS) 26.8 26.8 39.1 23.1 17.3 7.1 7.1 14.3 14.3 Armidale Animal Breeding Summer Course, UNE, Feb. 2006
A Quantitative Overview to Gene Expression Profiling in Animal Genetics Another (NEW?) Constraint: Amount of RNA A M avium slope 18 days 3 3-3-3 M avium broth 18 days 10 1-2-2-1-2-1-2-1-2-1 B M para broth 10 weeks 5 1-2-2-1-1 C M para broth 12 weeks 6 1-1-4-5-2-1 D M para in-vivo 3 1-1-1 E Not interested in Amplifying Armidale Animal Breeding Summer Course, UNE, Feb. 2006
A Quantitative Overview to Gene Expression Profiling in Animal Genetics Another (NEW?) Constraint: Amount of RNA A B A C Importance due to Transitivity of AB with BC and BD A D A E B C B D Procedure: Five configurations will be proposed and the statistical optimality of each evaluated. B E C D C E D E Armidale Animal Breeding Summer Course, UNE, Feb. 2006
A Quantitative Overview to Gene Expression Profiling in Animal Genetics 3 3 3 1 2 2 1 2 1 2 1 2 1 1 2 2 1 1 1 1 4 5 2 1 1 1 1 Armidale Animal Breeding Summer Course, UNE, Feb. 2006
A Quantitative Overview to Gene Expression Profiling in Animal Genetics Configuration 1 3 3 3 1 2 2 1 2 1 2 1 2 1 1 2 2 1 1 1 1 4 5 2 1 1 1 1 Armidale Animal Breeding Summer Course, UNE, Feb. 2006
A Quantitative Overview to Gene Expression Profiling in Animal Genetics Configuration 2 3 3 3 1 2 2 1 2 1 2 1 2 1 1 2 2 1 1 1 1 4 5 2 1 1 1 1 Armidale Animal Breeding Summer Course, UNE, Feb. 2006
A Quantitative Overview to Gene Expression Profiling in Animal Genetics Configuration 3 3 3 3 1 2 2 1 2 1 2 1 2 1 1 2 2 1 1 1 1 4 5 2 1 1 1 1 Armidale Animal Breeding Summer Course, UNE, Feb. 2006
A Quantitative Overview to Gene Expression Profiling in Animal Genetics Configuration 4 3 3 3 1 2 2 1 2 1 2 1 2 1 1 2 2 1 1 1 1 4 5 2 1 1 1 1 Armidale Animal Breeding Summer Course, UNE, Feb. 2006
A Quantitative Overview to Gene Expression Profiling in Animal Genetics Configuration 5 3 3 3 1 2 2 1 2 1 2 1 2 1 1 2 2 1 1 1 1 4 5 2 1 1 1 1 Armidale Animal Breeding Summer Course, UNE, Feb. 2006
A Quantitative Overview to Gene Expression Profiling in Animal Genetics Imp Weight Squared Error 1 2 3 4 5 1 2 3 4 5 4 6 5 6 6 5 4 1 4 4 1 2 0 2 1 0 0 4 0 1 4 4 2 3 2 2 3 4 1 0 0 1 4 1 0 0 0 0 0 1 1 1 1 1 3 5 5 4 4 5 4 4 1 1 4 4 4 5 5 5 5 0 1 1 1 1 1 0 0 0 0 0 1 1 1 1 1 2 2 0 2 3 2 0 4 0 1 0 1 0 0 0 0 0 1 1 1 1 1 4 3 3 3 3 3 1 1 1 1 1 SSE 17 14 11 16 18 0 1 2 1 0 0 MSE .74 .64 .48 .66 .75 A B A C A D A E Conclusion: Configuration 3 B C B D B E C D C E D E Noise D D Armidale Animal Breeding Summer Course, UNE, Feb. 2006
A Quantitative Overview to Gene Expression Profiling in Animal Genetics T2 Stress Short recovery(1 day) T0 T1 T3 T4 7 day acclimation Long recovery(7 days) ONE LAST EXAMPLE (E de la Vega, K Wilson, AIMS, Townsville) • Osmotic stress( 35 to 10 ppt. stress for 8 hours) • Hypoxic stress(1ppm. DO / 8 hours) • Thermal stress(35.5 C / 24 hours) • Controls( kept at 35ppt, 28 C, >6 ppm. DO) * * * * *Sampled 9 shrimp/treatment for gene expression analysis Max. 24 Hybridisations! Armidale Animal Breeding Summer Course, UNE, Feb. 2006
A Quantitative Overview to Gene Expression Profiling in Animal Genetics ONE LAST EXAMPLE (E de la Vega, K Wilson, AIMS, Townsville) Days: 0 0.5 1.5 7.5 Long Recovery Short Recovery Stress Period T2 T1 T3 T4 12 TANKS Control Osmotic Hypoxic Thermal Armidale Animal Breeding Summer Course, UNE, Feb. 2006
A Quantitative Overview to Gene Expression Profiling in Animal Genetics ONE LAST EXAMPLE (E de la Vega, K Wilson, AIMS, Townsville) Days: 0 0.5 1.5 7.5 Long Recovery Short Recovery Stress Period T2 T1 T3 T4 12 TANKS Control Osmotic Hypoxic Thermal Armidale Animal Breeding Summer Course, UNE, Feb. 2006
A Quantitative Overview to Gene Expression Profiling in Animal Genetics ONE LAST EXAMPLE (E de la Vega, K Wilson, AIMS, Townsville) Days: 0 0.5 1.5 7.5 Long Recovery Short Recovery Stress Period T2 T1 T3 T4 12 TANKS Control Osmotic Hypoxic Thermal Armidale Animal Breeding Summer Course, UNE, Feb. 2006
A Quantitative Overview to Gene Expression Profiling in Animal Genetics ONE LAST EXAMPLE (E de la Vega, K Wilson, AIMS, Townsville) Long Recovery Short Recovery Stress Period T2 T1 T3 T4 12 TANKS Control Osmotic Hypoxic Thermal = Pool RNA of 3 prawns (ie., one per tank per treatment) Then, repeat the whole experiment for a total of 24 hybridisations. Armidale Animal Breeding Summer Course, UNE, Feb. 2006
A Quantitative Overview to Gene Expression Profiling in Animal Genetics MICROARRAY EXPERIMENTAL DESIGN Take home message III: “Graphical representation tells the history” • The structure of the graph determines which effects can be estimated and the precision of the estimates. • Two mRNA samples can be compared only if there is a pathjoining the corresponding two vertices (or samples). • The precision of the estimated contrast depends on the number of paths joining the two vertices and is inversely related to the length of the paths. • Direct comparisons within slides yield more precise estimates than indirect ones between slides. • Pooling issues can be immediately spotted • Equal amounts of RNA samples in a pool are essential • Samples intervene in a pool once only Avoid messy analysis Armidale Animal Breeding Summer Course, UNE, Feb. 2006