Comparison of Comparative Genomic Hybridization Technologies Across Microarray Platforms
40 likes | 273 Views
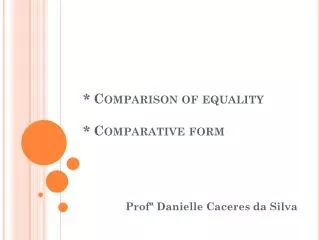
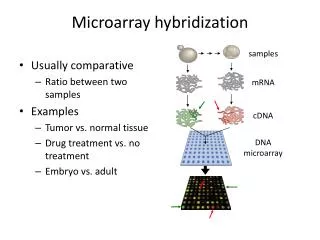
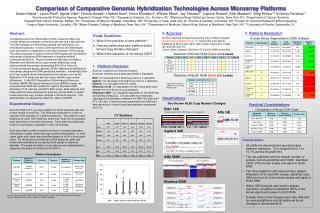
chr8. chr17. 3. 3. +8q24. -17p12. 2. 2. 1. 1. 0. 0. -1. -1. -2. -2. Chr 8q amplification. Chr 17p deletion. Replicate 1 Replicate 2 Replicate 3 Replicate 4. Replicate 1 Replicate 2 Replicate 3 Replicate 4.

Comparison of Comparative Genomic Hybridization Technologies Across Microarray Platforms
E N D
Presentation Transcript
chr8 chr17 3 3 +8q24 -17p12 2 2 1 1 0 0 -1 -1 -2 -2 Chr 8q amplification Chr 17p deletion Replicate 1 Replicate 2 Replicate 3 Replicate 4 Replicate 1 Replicate 2 Replicate 3 Replicate 4 Comparison of Comparative Genomic Hybridization Technologies Across Microarray Platforms Susan Hester1, Laura Reid2, Agnes Viale3, Norma Nowak4, Herbert Auer5, Kevin Knudtson6, William Ward1, Jay Tiesman7, Caprice Rosato8, Aldo Massimi9, Greg Khitrov10 & Nancy Denslow11 1Environmental Protection Agency, Research Triangle Park, NC; 2Expression Analysis, Inc., Durham, NC; 3Memorial Sloan Kettering Cancer Center, New York, NY; 4Department of Cancer Genetics, Roswell Park Cancer Institute, Buffalo, NY; 5Columbus Children’s Hospital, Columbus, OH; 6University of Iowa, Iowa City, IA; 7Procter & Gamble, Cincinnati, OH; 8Center for Genome Research & Biocomputing, Oregon State University, Corvallis, OR; 9Albert Einstein College of Medicine, New York, NY; 10Department of Medicine, Mount Sinai School of Medicine, New York, NY; 11University of Florida, Gainesville, FL 2. Accuracy: HL-60 is reported to have the following copy number changes: Amplification at 8q24,Trisomy 18, monosomy X as well as Deletions at 5q11.2-q31, 6q12, 9p21.3-p22, 10p12-p15, 14q22-q31 and17p12-p13.3. Cancer Genet Cytogenet. 2003 Nov;147(1):28-35; Peiffer et al.(2006) 3. Platform Resolution: Circular Binary Segmentation (CBS) Analysis Abstract: • Study Questions: • What is the precision of each platform? • How accurately does each platform detect Known Copy Number changes? • What is the resolution of microarray CGH? Comparative Genomic Hybridization (CGH) measures DNA copy number differences between a reference genome and a test genome. The DNA samples are differentially labeled and hybridized to an immobilized substrate. In early CGH experiments, the DNA targets were hybridized to metaphase chromosome spreads in FISH assays. This technology later evolved so that the DNA targets are hybridized to microarrays containing cDNA fragments or bacterial artificial chromosomes (BACs). Recent commercial offerings from Agilent, Affymetrix and Illumina derive copy number differences using oligonucleotide microarrays representing 500,000 or more loci. In most commercial assays, genomic DNA is labeled and hybridized to microarrays designed for SNP genotyping analyses. Interestingly, Auer et al. has recently shown that expression microarrays, such as the Affymetrix U133 series can also be used to identify copy number differences. In the 2007 Association of Biomolecular Resource Facilities (ABRF) Microarray Research Group (MARG) project, we analyzed HL60 DNA with 5 platforms: Agilent, Affymetrix 500K, Affymetrix U133, Illumina, and RPCI BAC arrays. Data obtained from these platforms were assessed for precision and the ability to detect known and novel copy number changes in the HL60 genome. This abstract does not necessarily reflect the views of the EPA. Detection of Known HL60 Gains and Losses 1. Platform Precision: Basis for Coefficient of Variance Analysis- Summary statistics and boxplot generated in Sigmaplot. BAC: CV calculated from HL60/lung ratios in 4 replicates. Agilent: CV calculated from HL60/lung ratios in 4 replicates. Illumina: CV calculated from 4 R values. Affymetrix U133: CV calculated from the 16 possible ratios between the 4 HL60 and 4 lung replicates. Affymetrix 500K: CV calculated separately for the 250K Nsp and 250Sty GeneChips. CV calculated from Intensities calculated from Affymetrix software for 4 NSP CEL files and 4 STY CEL files. These files were augmented from Affymetrix data repository in order to calculate expression summaries and CVs. Detection of Novel* HL60 Gains and Losses *Agreement of at least 2 platforms in the same location span Visualizations: Two Known HL60 Copy Number Changes Experimental Design: Practical Considerations: Comparison of Array CGH Costs BAC 19K Display prepared from CBS Analysis of one replicate Genomic DNA (0.5-3 mg) was isolated from HL60 leukemia cells and human female normal lung. The DNA was distributed to 3 sites for replicate CGH analyses on 5 different platforms. Two platforms used traditional (2-color) CGH methods, where both HL60 and lung targets were hybridized to the same microarray. Three platforms hybridized HL60 or lung targets to separate (1-color) microarrays. Each site relied on platform-specific protocols for target preparation, hybridization, quality review and copy number determination. In most cases, gains and losses were identified based on HL60 to lung signal ratios. For the Illumina and Affymetrix 500K platforms, gains and losses were evaluated by comparing HL60 signals to reference datasets. The probe annotation on all platforms was standardized to sequence information in NCBI build 35 (HG17). Affy GE CV Statistics -17p12 Agilent 44K +8q24 Chr 8q amplification • Conclusions: • All platforms demonstrated good precision between replicates. CVs ranged from 2.1 to 10.7% across the platforms. • The two platforms with the largest number of probes, Illumina and Affymetrix 500K, identified 100% of the known losses and gains in HL60 DNA. • The three platforms with fewer probes, Agilent, Affymetrix U133 and BAC arrays, identified most (89%) but not all of the known losses and gains in HL60 DNA. • When CBS Analysis was used to assess resolution, all platforms detected 100% of the known gains and losses in HL60 DNA. • Overall, three novel changes were also detected by various platforms and all platforms found changes in chromosome16. Chr 17p deletion Platform Descriptions Affy 500K Display generated by Partek Software Illumina 550K +8q24 -17p12 Replicate 1 Replicate 2 Replicate 3 Replicate 4 Replicate 1 Replicate 2 Replicate 3 Replicate 4 The test sites were either: RPCI, Roswell Park Cancer Institute; MSK, Memorial Sloan-Kettering Institute Genomic Core; or CPH, Columbus Pediatric Hospital.