Download
1 / 7
80 likes | 253 Views
Emisiones Contaminantes Diesel Nivel de Impacto en México según la Edad del Parque. Nivel de Emisiones EPA por año. 20. 2.0. 16 gr a 4 gr. NOx + HC. 1.0 a 0.1 gr. 15. 1.5. NOx. (No regulado). NOx. Partículas PM (g/bhp-hr). Óxidos de Nitrógeno (g/bhp-hr). NOx + HC. 10. 1.0.

E N D
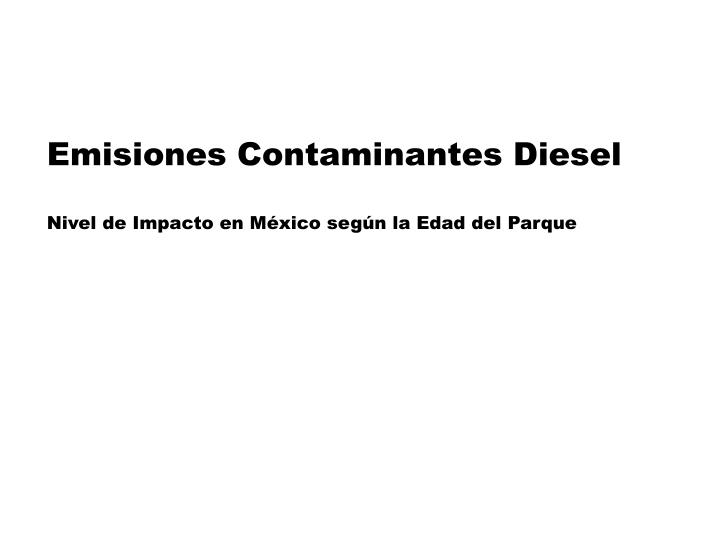
Emisiones Contaminantes Diesel Nivel de Impacto en México según la Edad del Parque
Nivel de Emisiones EPA por año 20 2.0 16 gr a 4 gr NOx + HC 1.0 a 0.1 gr 15 1.5 NOx (No regulado) NOx Partículas PM (g/bhp-hr) Óxidos de Nitrógeno (g/bhp-hr) NOx + HC 10 1.0 4 gr a 2.5 gr PM (No regulado) NOx 5 0.5 PM NOx + HC PM Urbanos PM 0 0.0 1970 1975 1980 1985 1990 1995 2000 2005 2010 2015 Año modelo
Fuente: Volumen de Vehículos en USA y México
Fuente: Edad de Parque Vehicular en México: Carga y Pasaje
Unidades Pasaje* 29,614 36,075 31,363 15,614 10,769 11,172 Unidades Carga* 76,112 94,893 66,227 61,285 55,354 140,362 Total 105,726 130,968 97,590 76,899 66,123 151,534 NOx (gr/bhp-hr) 4 4 5 10.7 10.7 16 Generación estimada de NOx en ton/hr* por edad, nivel de emisiones y volumen de parque vehicular *El nivel de emisiones en ton/hr se calcula considerando la potencia promedio del motor por la clase ó segmento del vehículo. Para carga se consideran clases 4 a 8 con 250 y 450 hp promedio y para pasaje urbano y foráneo con 180 y 300 hp promedio
Unidades Pasaje* 29,614 36,075 31,363 15,614 10,769 11,172 Unidades Carga* 76,112 94,893 66,227 61,285 55,354 140,362 Total 105,726 130,968 97,590 76,899 66,123 151,534 PM (gr/bhp-hr) 0.1 0.1 0.1 0.6 0.6 NR Estim. 1.3 Generación estimada de Partículas en ton/hr* por edad, nivel de emisiones y volumen de parque vehicular *El nivel de emisiones en ton/hr se calcula considerando la potencia promedio del motor por la clase ó segmento del vehículo. Para carga se consideran clases 4 a 8 con 250 y 450 hp promedio y para pasaje urbano y foráneo con 180 y 300 hp promedio
Conclusiones • La oportunidad para reducir de manera importante el nivel de contaminación es renovar el parque vehicular más antiguo. • Sustituir vehículos antiguos por el nivel EPA’98 es un avance muy significativo