Download

1 / 17
200 likes | 285 Views
ELECTROCHEMICAL IMPEDANCE SPECTROSCOPY (EIS)

E N D
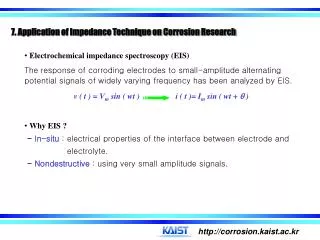
Introduction Syed Taha • Electrochemical Impedance Spectroscopy (EIS) is a very complex subject in electroanalytical chemistry. • To understand electrochemical impedance spectroscopy, we will start with the concept of electrical resistance via Ohm's law.
Continue…. • This description of resistance via Ohm's law applies specifically to direct current (DC), where a static voltage or current is applied across a resistor. • Impedance, by contrast, is a measure of the resistance a circuit experiences related to the passage of an alternating electrical current (AC). • In an AC system, the applied signal is no longer static but oscillates as a sinusoidal wave at a given frequency. • The equation for impedance is analogous to Ohm's law; however, instead of using for resistance we use for impedance
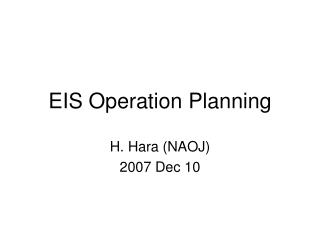
Figure 1.2 Simplified Electrochemical Impedance Spectroscopy Diagram. If the input signal is potential, then the green wave represents the input sinusoidal potential signal and the red wave represents the output sinusoidal current.
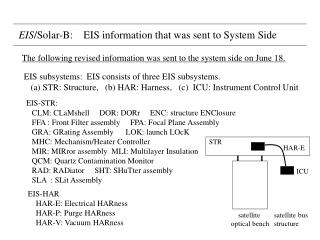
E(t)cos( Figure 1.3 Simplified Electrochemical Impedance Spectroscopy Diagram with Phase Angle. The teal sinusoidal wave represents input potential signal visually overlapped in time with the output current signal. Phase angle represents the shift in phase when the input and output signals are overlapped in time.
EIS Example… Qandeel Ali • A complete EIS experiment consists of a sequence of sinusoidal potential signals centered around a potential setpoint. • The amplitude of each sinusoidal signal remains constant, but the frequency of the input signal will vary. • Typically, frequencies of each input signal are equally spaced on a descending logarithmic scale from ~10 kHz - 1 MHz to a lower limit of ~10 mHz - 1 Hz. • For each input potential, a corresponding output current is measured at a given frequency.
Figure 1.4 Visualization of EIS experiment. The applied input signal and measured output signal have the same frequency.
Figure 1.5 Lissajous plot where the input potential and output current are perfectly in phase. The resulting curve is a straight line with a slope proportional to the impedance at that frequency.
Figure 1.6 Lissajous plot where the input potential and output current are out of phase. The resulting plot is an oval.
EIS Instrumentation Zeeshan Haider
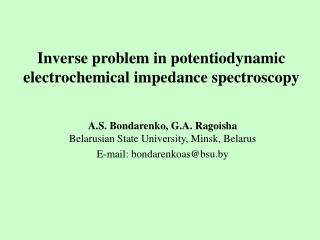
Bode plot MianAhmer • In a bode plot, |Z| vs. frequency is displayed on the primary vertical axis and is displayed on the secondary vertical axis. • Frequency and impedance magnitude are normally plotted on a logarithmic scale,while the phase angle is displayed linearly. • There is another way to express EIS data. Using polar coordinates,let us plot |Z| as a ray originating from the center at an angle equal to the phase angle (Figure 2.3). Figure 2.3 Plotting of Impedance Magnitude and Phase Angle in Polar Coordinates
Continue… If we move from polar to cartesian coordinates, we can break the impedance magnitude into its x and y components (Figure 2.4).