Download
1 / 28
280 likes | 473 Views
…WINTER PREVIEW 2012-13…. ( for NON wx geeks) EXTREME OR NOT EXTREME THAT IS THE QUESTION !!!! . …WINTER 2009-10… 2010-11 featured lots of cold and at times significant cold WINTER 2011-12 the exact opposite winter 2009-10 … and winter 2010-11.

E N D
…WINTER PREVIEW 2012-13…. ( for NON wx geeks) EXTREME OR NOT EXTREME THAT IS THE QUESTION !!!!
…WINTER 2009-10… 2010-11 featured lots of cold and at times significant cold WINTER 2011-12 the exact opposite winter 2009-10 … and winter 2010-11
See that BIG PURPLE blob NORTH of Alaska? That featured called the PV (Polar Vortex) stays up there al last winter. Normally that feature is over eastern Canada. By staying up there it get all the super cold air stuck up there over Alaska And it prevent any big cold air outbreaks from getting into the US
Now compare my explanation to someone’s else ‘EXPLANATION” of what went wrong Last winterJapan Tsunami Debris wave?? Folks that is just plain ‘ol Bravo Sierra (BS) you see WHY looking at Last winter is SOOOO Important ? If you cannot “ see it “ ..if you explanation is some BS theory .. then how can you get THIS coming winter forecast right ?
AUTUMN PATTERN 2012 (10/8/12) Research shows that OCTOBER weather pattern are often clues for the upcoming Winter But for some reason that is not the case with NOVEMBER weather patterns So far the Upper air Jet stream patterns are VERY different from what we saw last winter
This image shows TWO weather Models -- left side EUROPEAN MODEL .. Right side GFS . This is for the END of OCTOBER These maps says eastern US is going to turn WARM last week of OCT into NOV but western US will turn cold. And western Canada cold and SNOW. Often times.. Early cold and snow in western Canada helps supply cold air for central and eastern US later in the winter months
OCT 15… ORANGE ACTUAL SNOWFALL …Blue = Above Normal Snow BIG increase in snow cover over last 2 weeks
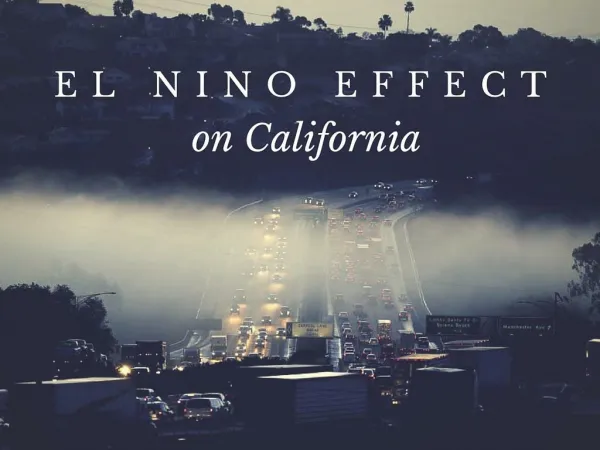
EL NINO… Most Winter forecasts that have already been issued were heavily based on weak El Nino lasting through the Winter WEAK El Nino events OFTEN bring About colder & snowier then Normal Winters for some portion of the central/ eastern CONUS
BUT…Data shows the El Nino has died off over last 21-30 days
LETS TAKE ABOUT THE CFS version 2.0 As a general rule over the last 20 years climate models have been pretty bad and next to useless. But CFS version 2.0 is different. WHY? The CFS model in an ensemble of 16 runs AND based on the last 14 days. The MONTHLY Model is based on 10 day time increments. As conditions change so does the CFS Model. Is that a good thing or bad ?
At end of APRIL the CFS for JUNE 2012… showing WET and cool over the midwest and hot over pacific NW.
But.. once the CFS saw El Nino breaking down.. CFS did change BIG TIME. 20 MAY - 29 MAY 2012 The CFS Models runs from last 10 days of MAY show EXTREME HEAT and DROUGHT
CFS MODEL for DEC JAN FEB seem to be awfully warm This run for DEC 2012 based on the end of AUG AND El Nino still thriving
This run for JAN 2013 based on the end of AUG AND El Nino still thriving
This run for FEB 2013 based on the end of AUG AND El Nino still thriving
The CFS Models runs from OCT 6 to OCT 16.. Shows cold air over Canada in NOV and a VERY WARM WINTER Jan Feb March of 2013 !!! But with all the Big changes happening over last 2-3 weeks new runs of CFS Likely to be Much colder
WHAT ABOUT ANALOG YEARS For those that do NOT know what we mean by ANALOG years in the weather biz… the term refers to the method of looking at SEVERAL key parameters in the atmospheric then searching past (climate) for similar conditions. The idea here is to give the forecast clues or TRENDS about what the upcoming season will look like. SOMETIMES the analog works.. MOSTLY for stable patterns.. But you have to key on the right “ things” in the atmosphere to work on
WHAT ABOUT ANALOG YEARS THE QBO • the QBO quasi-biennial oscillation (QBO) is high level wind at the very top of the atmosphere ( 30 mb) that exists over the Equator that oscillates from East (negative QBO) to West ( Positive QBO) . A full cycle can take anywhere from 18 to 30 months . The strongest Positive values are usually around +15.00 or so while the strongest Negative values will exceed -25.00 or so. The QBO winds work there way down to into the Lower levels and affect weather patterns. • http://en.wikipedia.org/wiki/Quasi-biennial_oscillation • LINK FOR ACTUAL QBO DATA http://www.esrl.noaa.gov/psd/data/correlation/qbo.data
WHAT ABOUT ANALOG YEARS THE QBO strongly POSITIVE QBO values correlate to Non Blocking weather patterns in the Jet stream And strongly Negative QBO values in the cold season Months = +AO and +NAO patterns BUT… QBO values that are “weak” (-10 to +10)strongly favor Blocking patterns over N Hemisphere in the cold season months ( NDJFM) So… ASSUMING the OCT QBO values ( comes out 11/5/12) will be “ rising “ (moving to zero) and that trend continues for NOV values ( comes out 12/5/12) … what will the QBO be like in DJFM?? JAN 2012 -16.07 FEB 2012 -15.25 MARCH 2012 -16.74 APRIL 2012… -17.62 MAY 2012… -22.04 JUNE 2012…. -25.89 JULY 2012… -27.82 AUG 2012… -27.93 SEPT 2012… -26.60QBO is beginning to weaken OCT 2012 ?? Data comes out 11/5/12 NOV 2012 ??? Data comes out 12/5/12
WHAT ABOUT ANALOG YEARS THE QBO HIGH Probability that OCT values will be -20 to -25 and NOV values between -15 to -20.. But again this is FORECAST/ assumptionThis IMPLIES that QBO will be moving towards ZERO during JAN …FEB MARCH 2013 . SOOOOOO.. Lets look at ALL the QBO autumns with strongly - QBO values that rose to -10 or high (towards 0). QBO ANALOG WINTERS2003-04 1989-90 1984-85 1979-80 1970-71
STARTING NOV 1… wxrisk.com Will be using the Prof Zielinksi WINTER STORM INDEX SCALE this is a proven well research INDEX that can be used all around the country. I will be posting more about it on the web site soon And S.E.C.S. --(SEX) Significant East Cost Snowstorm newsletter a subscription service… with 2 levels of coverage BASIC and ADVANCED