Randomized Block Design
Randomized Block Design. Caffeine and Endurance in 9 Bicyclists W.J. Pasman, et al. (1995). “The Effect of Different Dosages of Caffeine on Endurance Performance Time,” International Journal of Sports Medicine , Vol. 16, pp225-230. Randomized Block Design (RBD).

Randomized Block Design
E N D
Presentation Transcript
Randomized Block Design Caffeine and Endurance in 9 Bicyclists W.J. Pasman, et al. (1995). “The Effect of Different Dosages of Caffeine on Endurance Performance Time,” International Journal of Sports Medicine, Vol. 16, pp225-230
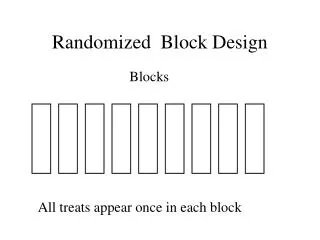
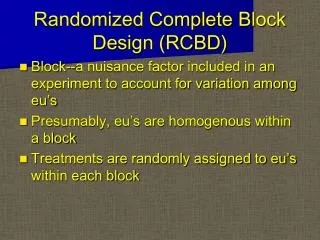
Randomized Block Design (RBD) • t > 2 Treatments (groups) to be compared • b Blocks of homogeneous units aresampled. Blocks can be individual subjects. Blocks are made up of t subunits • Subunits within a block receive one treatment. When subjects are blocks, receive treatments in random order. • Outcome when Treatment i is assigned to Block j is labeled Yij • Effect of Trt i is labeled ai • Effect of Block j is labeled bj • Random error term is labeled eij • Efficiency gain from removing block-to-block variability from experimental error
Randomized Complete Block Designs • Model (Block effects and random errors independent): • Test for differences among treatment effects: • H0: a1 = ... = at= 0 (m1= ... = mt ) • HA: Not all ai = 0 (Not all mi are equal) Typically not interested in measuring block effects (although sometimes wish to estimate their variance in the population of blocks). Using Block designs increases efficiency in making inferences on treatment effects
RBD - ANOVA F-Test (Normal Data) • Data Structure: (t Treatments, b Subjects/Blocks) • Mean for Treatment i: • Mean for Subject (Block) j: • Overall Mean: • Overall sample size: N = bt • ANOVA:Treatment, Block, and Error Sums of Squares
RBD - ANOVA F-Test (Normal Data) • ANOVA Table: • H0: a1 = ... = at= 0 (m1= ... = mt ) • HA: Not all ai = 0 (Not all mi are equal)
Pairwise Comparison of Treatment Means • Tukey’s Method- q from Studentized Range Distribution with n = (b-1)(t-1) • Bonferroni’s Method - t-values from table on class website with n = (b-1)(t-1) and C=t(t-1)/2
Expected Mean Squares / Relative Efficiency • Expected Mean Squares: As with CRD, the Expected Mean Squares for Treatment and Error are functions of the sample sizes (b, the number of blocks), the true treatment effects (a1,…,at) and the variance of the random error terms (s2) • By assigning all treatments to units within blocks, error variance is (much) smaller for RBD than CRD (which combines block variation&random error into error term) • Relative Efficiency of RBD to CRD (how many times as many replicates would be needed for CRD to have as precise of estimates of treatment means as RBD does):
Example - Caffeine and Endurance • Treatments: t=4 Doses of Caffeine: 0, 5, 9, 13 mg • Blocks: b=9 Well-conditioned cyclists • Response: yij=Minutes to exhaustion for cyclist j @ dose i • Data:
Example - Caffeine and Endurance • Would have needed 3.79 times as many cyclists per dose to have the same precision on the estimates of mean endurance time. • 9(3.79) 35 cyclists per dose • 4(35) = 140 total cyclists
RBD -- Non-Normal DataFriedman’s Test • When data are non-normal, test is based on ranks • Procedure to obtain test statistic: • Rank the k treatments within each block (1=smallest, k=largest) adjusting for ties • Compute rank sums for treatments (Ti) across blocks • H0: The k populations are identical (m1=...=mk) • HA: Differences exist among the k group means