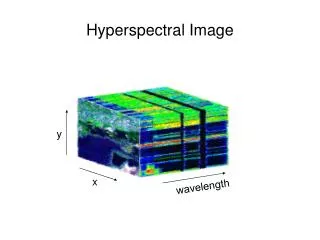
Mapping Crops Using Hyperspectral Data
Mapping Crops Using Hyperspectral Data. Jean Woods, Simon Eching, Ramesh Gautam, Scott Hayes, Mohammad Mostafavi, Tom Hawkins Land Use Program California Department of Water Resources. Sacramento – San Joaquin Delta Oxnard Plain / Ventura County Salinas Valley / Monterey County

Mapping Crops Using Hyperspectral Data
E N D
Presentation Transcript
Mapping Crops Using Hyperspectral Data Jean Woods, Simon Eching, Ramesh Gautam, Scott Hayes, Mohammad Mostafavi, Tom Hawkins Land Use Program California Department of Water Resources
Sacramento – San Joaquin Delta • Oxnard Plain / Ventura County • Salinas Valley / Monterey County • Imperial Valley Potential Study Areas
Determine which crops can be accurately differentiated from each other using hyperspectral imagery • Gain experience and skill in the analysis of hyperspectral data • Integrate the analysis of hyperspectral imagery with the analysis of time series Landsat data to identify crops Objectives
Final map of the flightlines • Image acquisition dates for each flight area • Resolution of imagery • Image format • File sizes and data storage space requirements • Level of correction/processing of data (geometric, radiometric and atmospheric) • Could a July or August flight be included next year to capture data on summer crops? • Will flightlines change next year? Preliminary Information Needed
Map winter/spring crops, primarily in the Delta. Classify orchard crops, vineyards, pasture, grain, alfalfa, asparagus, cabbage, lettuce, broccoli, onions/leeks, garbanzo beans, sugar beets, safflower, fallowed fields and other crops identified through ground truth collection. • Classify hyperspectral imagery to map crops in other study areas if ground truth data is available. Potential DWR Land Use Projects
Midsummer flights • Flights over additional agricultural areas such as the Salinas Valley or the entire Oxnard Plain Changes that Would Benefit Crop Mapping
Identify the specific bands of the HyspIRI data that are useful for differentiating between individual crops produced in the Delta. • Use hyperspectral data in conjunction with Landsat 8 time series data to map crops. Processes to Develop
Identify soil types with high and low albedo values to improve the delineation of hot pixels for estimating evapotranspiration with SEBAL or RESET • Create a surface temperature map of the Delta and examine its relationship to soil types and seepage Other Potential Applications of Hyperspectral Imagery