Benthic Mapping using Remote Sensing Data
Benthic Mapping using Remote Sensing Data. J. Cho Department of Integrated Environmental Science Bethune-Cookman University Daytona Beach, FL. Elements of Remote Sensing data acquisition and analysis. Camera system. sun. Electromagnetic (EM) Radiation. Consists of

Benthic Mapping using Remote Sensing Data
E N D
Presentation Transcript
Benthic Mapping using Remote Sensing Data J. Cho Department of Integrated Environmental Science Bethune-Cookman University Daytona Beach, FL
Elements of Remote Sensingdata acquisition and analysis Camera system sun
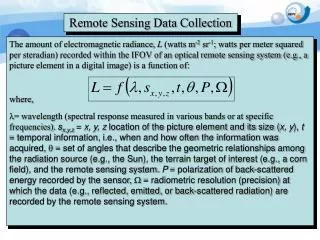
Electromagnetic (EM) Radiation • Consists of • An electrical field (E) • A magnetic field (M) • Both fields travel at the speed of light (c) • c = vλ • c: 3 x 10⁸ m/sec • v: frequency • λ: wavelength http://www.astronomynotes.com/light/s3.htm
EM Spectrum http://en.wikipedia.org/wiki/File:EM_spectrum.svg
http://ian.umces.edu/learn/modulepopup/barrier_islands_and_sea_level_rise/a_closer_look_at_seagrasseshttp://ian.umces.edu/learn/modulepopup/barrier_islands_and_sea_level_rise/a_closer_look_at_seagrasses
535 nm 760 nm
Spectral Reflectance Characteristics of Vegetationand Conventional Vegetation Indices Image source: http://extnasa.usu.edu/on_target/images_independent/nir_vegetation_graph.gif
Spectral reflectance of Submerged Aquatic Vegetation (SAV) at Varying Depths
Rationale and Objective • Remote detection of benthic features (i.e. seagrass) has been limited because of numerous factors including the influence of the water column • To develop algorithms that reduce water effects to improve remote detection and classification of shallow underwater features and seagrasses
Controlled experiments Selection of critical bands and data Reduction & compression Algorithm development Pure water effect removal Hyperspectral images corrected for conventional atmospheric distortions Water color, turbidity effects reduction Depth effect adjustment Images with enhanced benthic features
Water Correction Algorithm Development for Benthic Mapping L = Ls +Lv+ La + Lr + Lb L Lr Ls Lv Water La Lb
* water absorption can be derived from the following way 1 x (1-Aw/2) x Rr x (1-Aw/2) + Rw= Rm Aw and Rw are the functions of water depth * For any bottom panel, Rr can be directly measured Algorithm to model water effects
Pulley System String String 1.2 m 82 cm 53cm (Washington et al. 2012)
Reflectance(corrected) = f (ref(measured), depth)1 x (1-Aw/2) x Rr x (1-Aw/2) + Rw= Rm Water Volumetric Reflectance Water Absorption (Cho et al. 2010))
Data Extension into Deeper Depths • Beer-Lambert Law where Iz, λ is the light intensity at a given depth z, I0 is the light intensity present before any contact is made with the absorbing medium, and Kd is the downwelling attenuation coefficient. (Washington et al. 2012)
SAV (Seagrass) Pixels (24 pixels) (Cho et al. 2011)
Graphical User Interface (Cho et al. 2013)
Airborne AISA Hyperspectral data Acquisition and Analyses Mission-Aransas NERR, TX: July 2008 Application of the Algorithm on image data (Cho et al.)
(Cho et al.) 553 nm (Green Color Energy)
(Cho et al.) 694 nm (Red Energy)
(Cho et al.) 741 nm (NIR)
Applications of the Technology • John Wood, Ph.D. candidate, • Harte Research Institute Fellow in the Coastal and Marine Systems Sciences Program at Texas A&M University-Corpus Christi • The dissertation title: • Geospatial Analysis of Seagrass Remote Sensing Data From Redfish Bay, Texas..
Classification ResultsDepthExtrapolation out to 5 m. 535, 600, 620, 638, 656 nm
Classification ResultsDepthExtrapolation out to 0.6 m. 554, 695, 723, 742, 809 nm
Problems • Multi-spectral data and the current chlorophyll algorithms cannot distinguish seagrass from algal signals. • Airborne hyperspectral data are costly and have temporal/spatial limitations.
Seagrass • Vascular plants • Generally have higher Chl concentrations compared to macroalgae
Macroalgae • Non vascular • Varying levels of Chlorophyll and colors
Benthic Remote Sensing • Hyperspectral remote sensing has been suggested to be an effective tool in distinguishing spectral patterns of benthic habitats.(Fyfe 2003; Kutser et al. 2005)
Goal and Objectives Goal: • To develop a novel approach using satellite data that can be efficiently used to distinguish seagrass and macroalgae signals and help facilitate accurate benthic vegetation mapping Objectives: • Find spectral characteristics that can distinguish seagrass signals from those of macroalgae. • Map seagrass and macroalgae in Indian River Lagoon using satellite data.
HICO • The Hyperspectral Imager for the Coastal Ocean (HICO) is a hyperspectral sensor onboard the International Space Station (ISS). • HICO has a high signal-to-noise ratio that can facilitate benthic habitat mapping.
Methods • Obtaining and pre-processing HICO data over the Indian River Lagoon (March 2013). • Developing spectral models. • Benthic classification using four methods • supervised – Spectral Angle Mapper (SAM), • unsupervised, and • two new models – SlopeRED, and SlopeNIR) • Performance comparison of the four methods using high resolution aerial photos and field survey data.
Results Cho et al. 2014
Results Cho et al. 2014
Results Cho et al. 2014
Results Cho et al. 2014
Cho et al. 2014 Accuracy Assessment
Accuracy Assessment Cho et al. 2014
Conclusion • The study demonstrates that the advantage of selecting key narrow bands to accentuate the subtle differences between seagrass and macroalgae, which conventional classification methods do not perform well. • Combining the slope methods, SlopeRED andSlopeNIR, with a supervised classification method will lead to higher accuracies in distinguishing key vegitation.